
In 2026, ecommerce is a multi-trillion-dollar channel that keeps taking share from stores. Global online sales reached about $6.42 trillion in 2025,[1] and online now accounts for 16.9% of US retail.[2] That’s a big shift, so we’ve pulled together 90+ primary-sourced stats on market size, shoppers, mobile, payments, returns, social, AI, and the holiday peak.
Key Statistics (at a Glance)
- In 2025, global retail ecommerce sales reached about $6.42 trillion, on track for $7.89 trillion by 2028.[1]
- In Q1 2026, ecommerce made up 16.9% of all US retail sales.[2]
- In 2024, US shoppers spent $1.19 trillion online.[3]
- In 2025, mobile drove about 59% of global ecommerce sales.[4]
- In 2024, digital wallets handled 53% of global ecommerce payments, more than cards combined.[5]
- In 2026, the average ecommerce conversion rate sat at 2.74%.[6]
- In 2025, 70.22% of online carts were abandoned, averaged across 50 studies.[7]
- In 2025, an estimated 19.3% of US online sales were returned.[8]
- In 2025, US holiday online spend hit a record $257.8 billion.[9]
- In 2025, Amazon held 40.9% of US retail ecommerce sales.[10]
- Generative-AI traffic to US retail sites grew 4,700% year over year.[11]
- Key Statistics (at a Glance)
- Ecommerce Market Size and Growth
- Ecommerce Share of Retail Sales
- Online Shopping Behavior
- Mobile Commerce
- Ecommerce by Product Category
- Ecommerce by Region and Country
- Conversion Rates and Cart Abandonment
- Checkout and Payment Methods
- Ecommerce Returns
- Social Commerce
- AI in Ecommerce
- Holiday and Seasonal Shopping
- Top Retailers and Market Share
- Ecommerce Fraud and Trust
- Sources and Methodology
- Final Thoughts
- Frequently Asked Questions
- References
Ecommerce Market Size and Growth
In 2025, global retail ecommerce sales reached roughly $6.42 trillion, and forecasts put the channel at $7.89 trillion by 2028.[1] That’s steady growth, not a bubble. The curve has climbed every year since the pandemic pulled shopping online.
- In 2025, global retail ecommerce sales reached about $6.42 trillion.[1]
- $6.88 trillion is the projected global total for 2026.[1]
- $7.89 trillion is the forecast for 2028.[1]
- In 2024, US retail ecommerce sales hit $1.19 trillion, up 8.1% on the year.[3]
- In Q1 2026, US online sales reached $326.7 billion on a seasonally adjusted basis.[2]
- US ecommerce grew 9.8% year over year in Q1 2026.[2]
- The global B2B ecommerce market is set to reach $36 trillion by 2026, a 14.5% compound annual rate.[12]
- There are roughly 28 million ecommerce stores worldwide in 2026.[13]
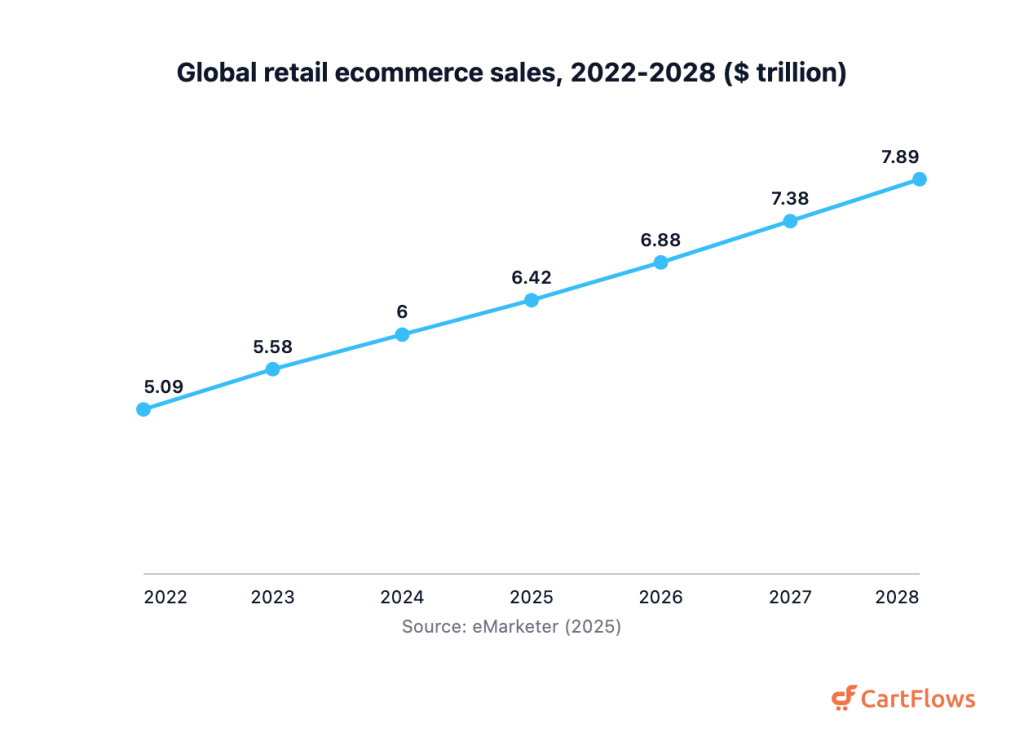
Global retail ecommerce sales, 2022-2028 ($ trillion)
Year by year, the global trajectory looks like this:[1]
| Year | Global retail ecommerce sales |
|---|---|
| 2022 | $5.09T |
| 2023 | $5.58T |
| 2024 | $6.00T |
| 2025 | $6.42T |
| 2026 | $6.88T |
| 2027 | $7.38T |
| 2028 | $7.89T |
One note on the headline number. Plenty of roundups still cite $6.9 trillion for 2025, but the newer forecast puts it closer to $6.42 trillion. We’d trust the fresher figure.
Ecommerce Share of Retail Sales
In 2026, online shopping accounts for 16.9% of all US retail spending, the highest quarterly share on record.[2] Globally, the share is higher still. They’re both climbing the same way.
- In Q1 2026, ecommerce was 16.9% of total US retail sales.[2]
- For full-year 2024, online made up 16.1% of US retail.[3]
- The US online share roughly doubled from 9.6% in 2018 to 16.1% in 2024.[3]
- Worldwide, ecommerce was 20.5% of retail in 2025, with 22.5% projected by 2028.[1]
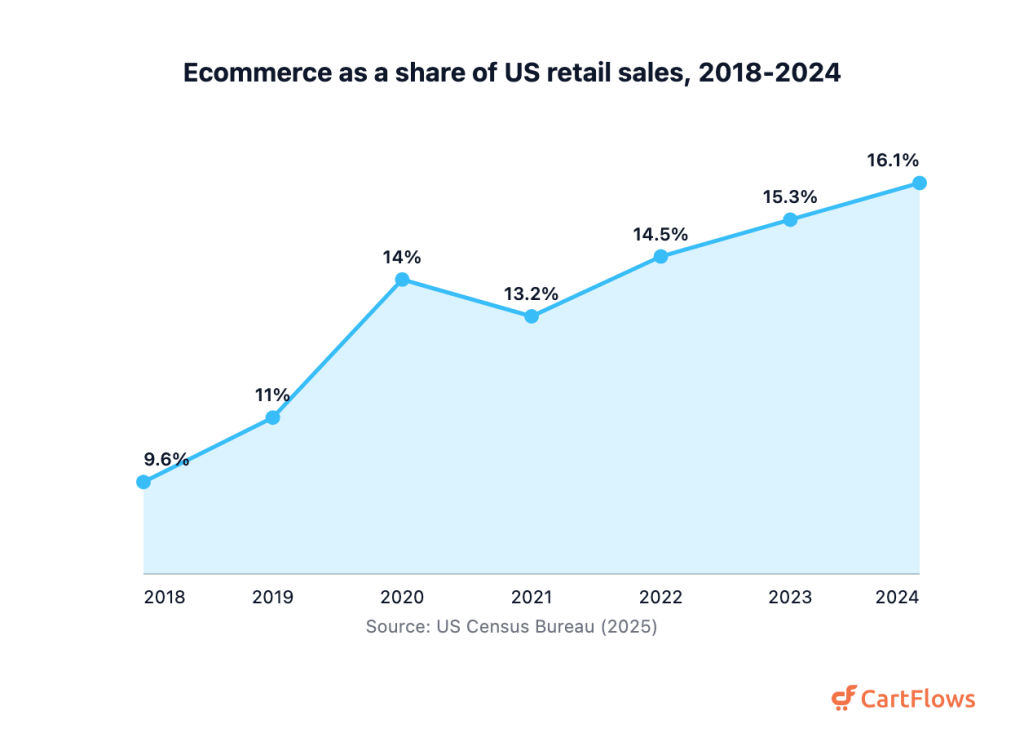
Ecommerce as a share of US retail sales, 2018-2024
Here’s the year-by-year picture for the US:[3]
| Year | US ecommerce sales | Share of US retail |
|---|---|---|
| 2018 | $512.6B | 9.6% |
| 2019 | $599.5B | 11.0% |
| 2020 | $787.9B | 14.0% |
| 2021 | $870.7B | 13.2% |
| 2022 | $1.03T | 14.5% |
| 2023 | $1.10T | 15.3% |
| 2024 | $1.19T | 16.1% |
The US still trails the global average, which tells you there’s room left to grow at home
Online Shopping Behavior
In 2025, about 2.77 billion people shopped online, roughly a third of everyone on earth.[14] Most of them buy often. And what pulls them to checkout hasn’t changed much across markets.
- In 2025, roughly 2.77 billion people shopped online, about 34% of the world’s population.[14]
- 56.1% of internet users aged 16+ buy something online every week.[15]
- In 2024, the average US online buyer spent $4,470 a year, against $1,620 worldwide.[14]
- Free delivery (50.5%) is the top purchase driver, ahead of coupons (39.1%) and reviews (32.1%).[16]
- Easy returns (31.2%) and a simple checkout (27.7%) round out the top five drivers.[16]
- Next-day delivery (27.6%) and loyalty points (24.7%) rank just behind them.[16]
- 81% of US adults call home delivery a must-have, with free shipping (76%) close behind.[17]
- 50% of shoppers weigh how easy checkout is when they pick where to buy.[18]
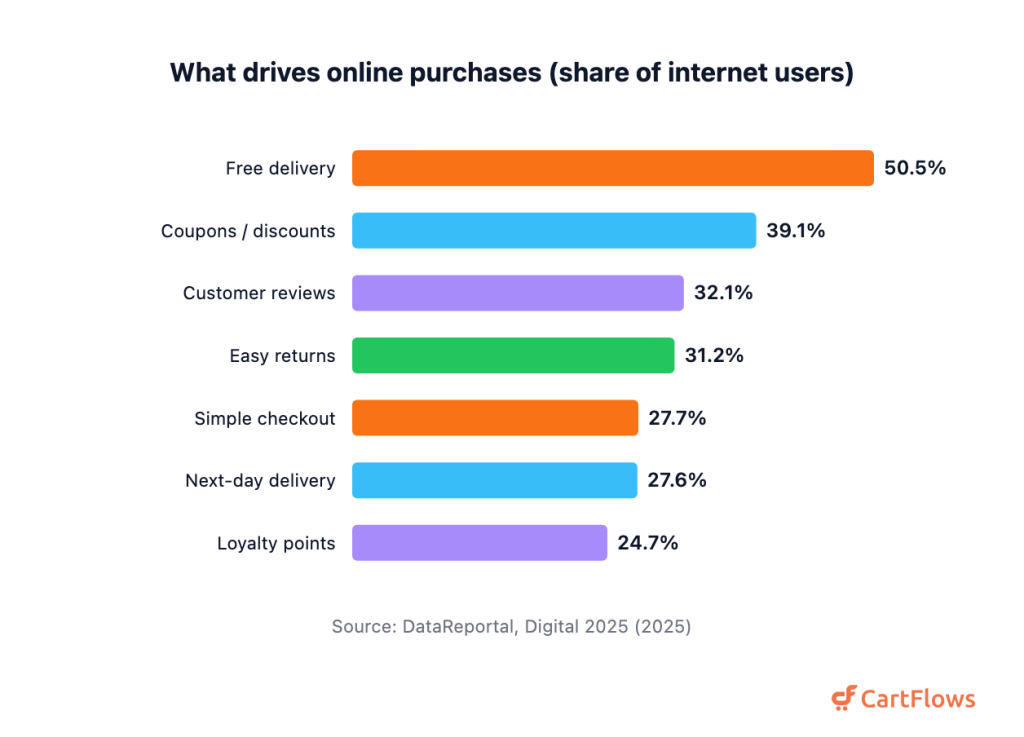
What drives online purchases (share of internet users)
Notice the pattern. Shipping, price, and a painless checkout beat everything else. That’s why we build a distraction-free WooCommerce checkout around exactly those levers.
Mobile Commerce
In 2025, mobile devices generated about 59% of all ecommerce sales worldwide, or roughly $2.51 trillion.[4] Phones now win most of the traffic too. The desktop era of online shopping isn’t coming back.
- In 2025, mobile drove about 59% of global ecommerce, near $2.51 trillion.[4]
- Mobile’s share is projected to reach 60% of global ecommerce in 2026.[4]
- In 2024, mobile was 44.1% of US online sales, worth $564.1 billion.[17]
- By our reading of the device figures, mobile drove about 63% of the growth in US online sales from 2023 to 2027.[17]
- 29.9% of internet users aged 16 to 64 buy something on a phone every week.[15]
- In June 2026, phones accounted for 76% of traffic to ecommerce sites.[6]
- There are about 161.6 million US mobile wallet users, or 64.9% of smartphone owners.[19]
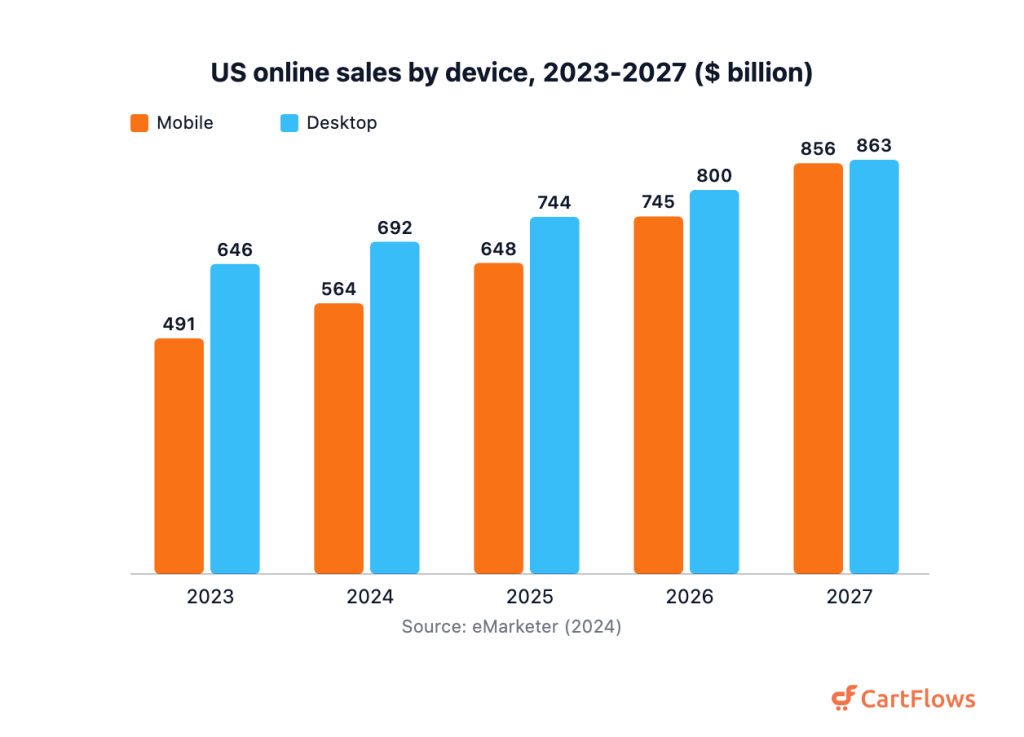
US online sales by device, 2023-2027 ($ billion)
The US device split, year by year, runs like this:[17]
| Year | Mobile online sales | Desktop online sales |
|---|---|---|
| 2023 | $491B | $646B |
| 2024 | $564B | $692B |
| 2025 | $648B | $744B |
| 2026 | $745B | $800B |
| 2027 | $856B | $863B |
Here’s the catch: mobile pulls the traffic but still lags desktop on order value. If your checkout isn’t built for a thumb, you’re leaking sales. That’s the whole point of mobile checkout optimization.
Ecommerce by Product Category
In 2024, fashion was the biggest online spending category, at about $771 billion in B2C sales.[14] Food and electronics follow close behind. The mix has shifted, and it’s now tilted toward everyday essentials.
- In 2024, fashion led online spending at about $771 billion.[14]
- Food ($680 billion) and DIY & hardware ($494 billion) ranked next.[14]
- Electronics ($465 billion) and furniture ($283 billion) round out the top five.[14]
- 67.1% of US digital buyers bought clothing in the past month, the most of any category.[20]
- Shoes (44.0%) and beauty products (43.1%) were the next most-bought categories.[20]
- By 2026, grocery is forecast to be the largest US ecommerce category, at 19.0% of online sales.[21]
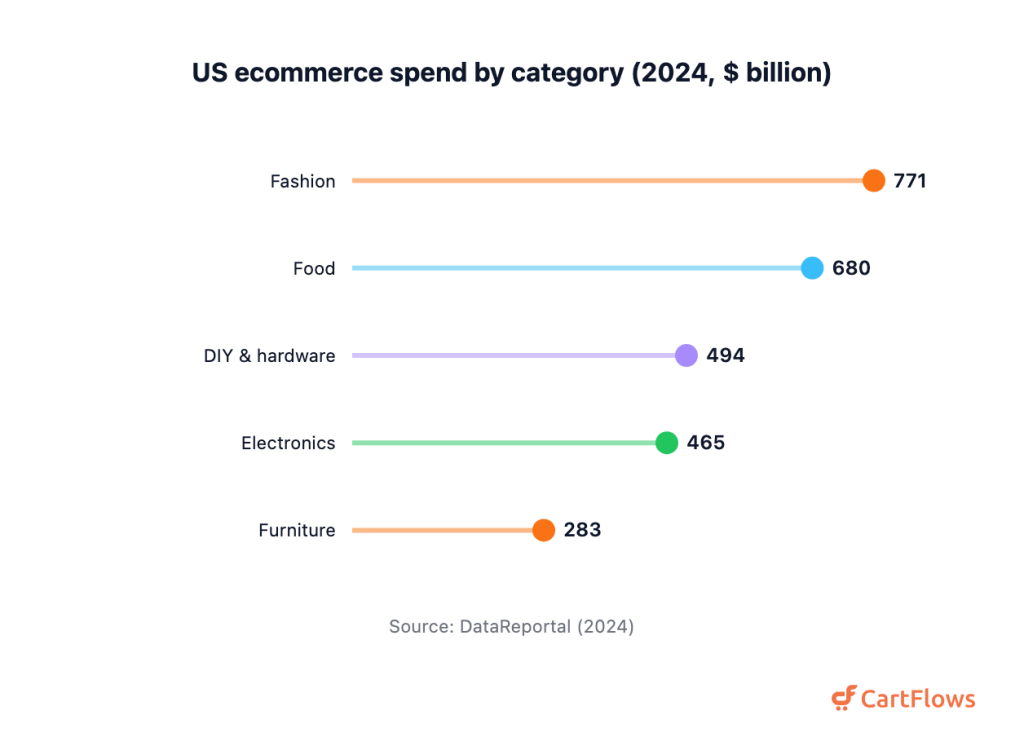
US ecommerce spend by category (2024, $ billion)
Grocery going online is the quiet story here. It’s high-frequency, low-margin, and it changes how often people open a shopping app.
Ecommerce by Region and Country
In 2025, Asia Pacific was the largest ecommerce region, holding 45.0% of global online revenue.[22] China alone dwarfs every other market. But the fastest growth isn’t there.
- In 2025, Asia Pacific held 45.0% of global ecommerce revenue.[22]
- By revenue, the largest national markets are estimated as China (~$3.45 trillion) and the US (~$1.38 trillion).[23]
- The UK (~$195 billion), Japan (~$169 billion), and South Korea (~$147 billion) follow.[23]
- India ranks first among 20 countries for ecommerce growth, at a 14.1% annual rate through 2027.[12]
- By share of retail, estimated penetration runs China 47%, UK 30.6%, South Korea 30%, Germany 18%, US 15.8%, and India 5%.[23]
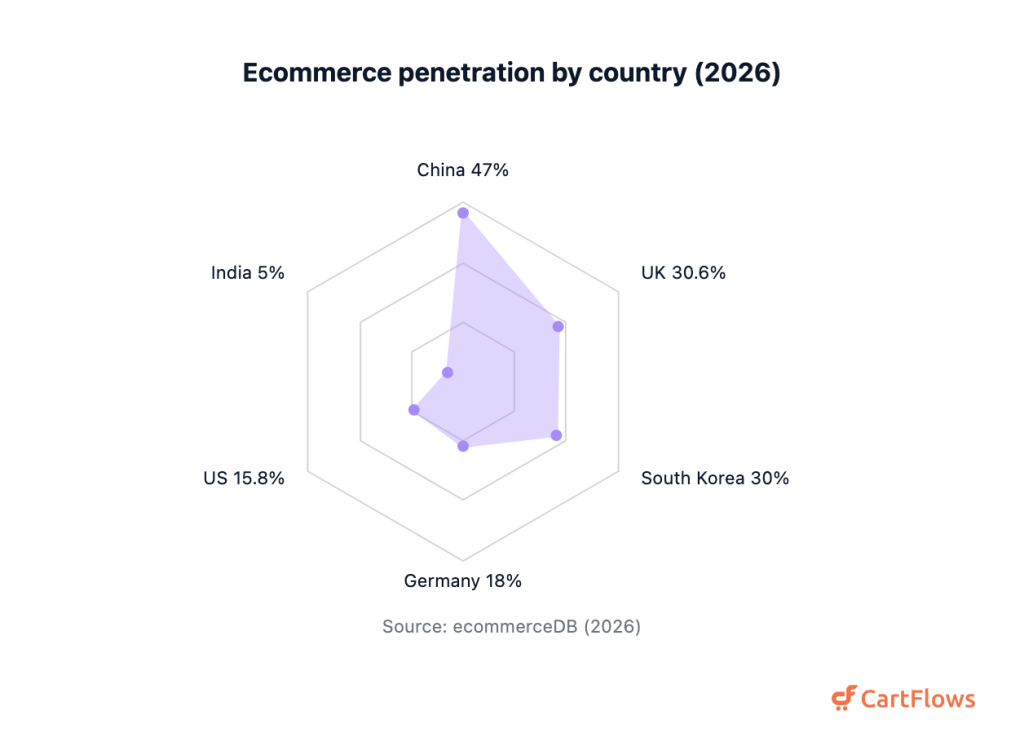
Ecommerce penetration by country (2026)
The US surprises people here. It’s a giant market by dollars, yet its online penetration still trails China and the UK by a wide margin.
Conversion Rates and Cart Abandonment
In 2026, the average ecommerce conversion rate was 2.74%, measured as completed purchases per visit.[6] Most of the traffic that lands never buys. And the bigger leak isn’t traffic, it’s the cart itself.
- In 2026, the global average ecommerce conversion rate was 2.74%.[6]
- By device in 2026, tablet led at 2.89%, with mobile at 2.86% and desktop at 2.46%.[6]
- Beauty & Personal Care converted best at 5.37%; Luxury & Jewelry trailed at 0.71%.[6]
- In 2025, 70.22% of online carts were abandoned, averaged across 50 studies.[7]
- Extra costs (48%) are the top reason shoppers abandon at checkout.[7]
- Forced account creation (26%) and card-security worries (25%) are the next biggest reasons.[7]
- In 2022, conversion fell from 3.05% at a one-second load to 0.67% at four seconds.[24]
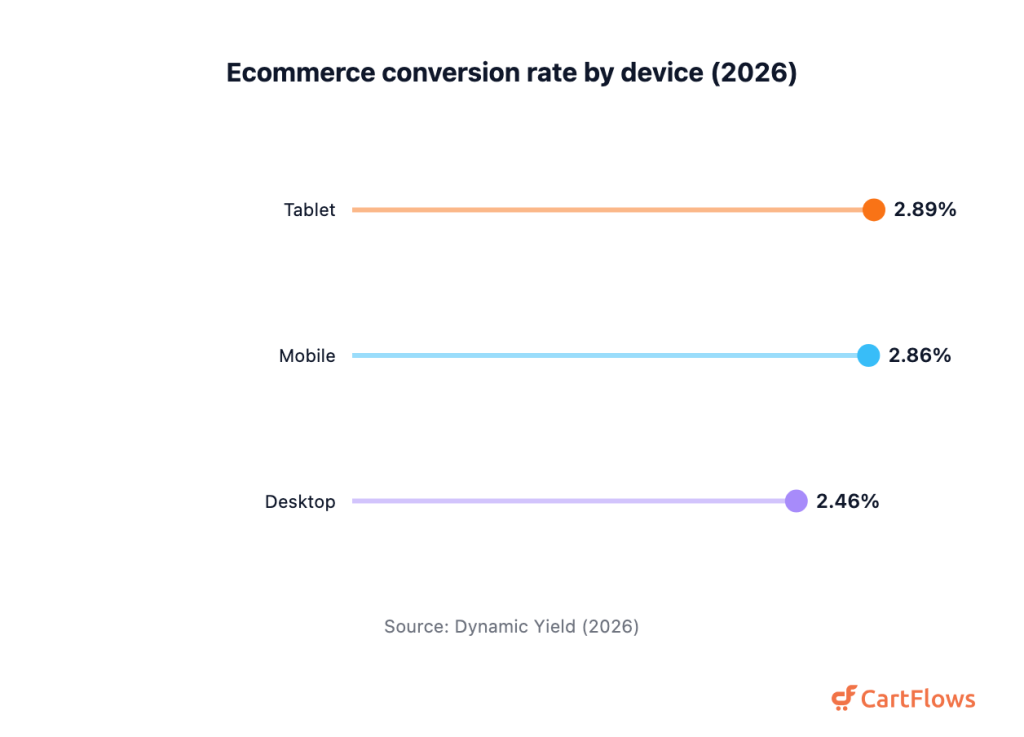
Ecommerce conversion rate by device (2026)
Most guides still say desktop wins checkout. On live 2026 data, that gap has nearly closed, so a mobile-weak checkout costs you real money.
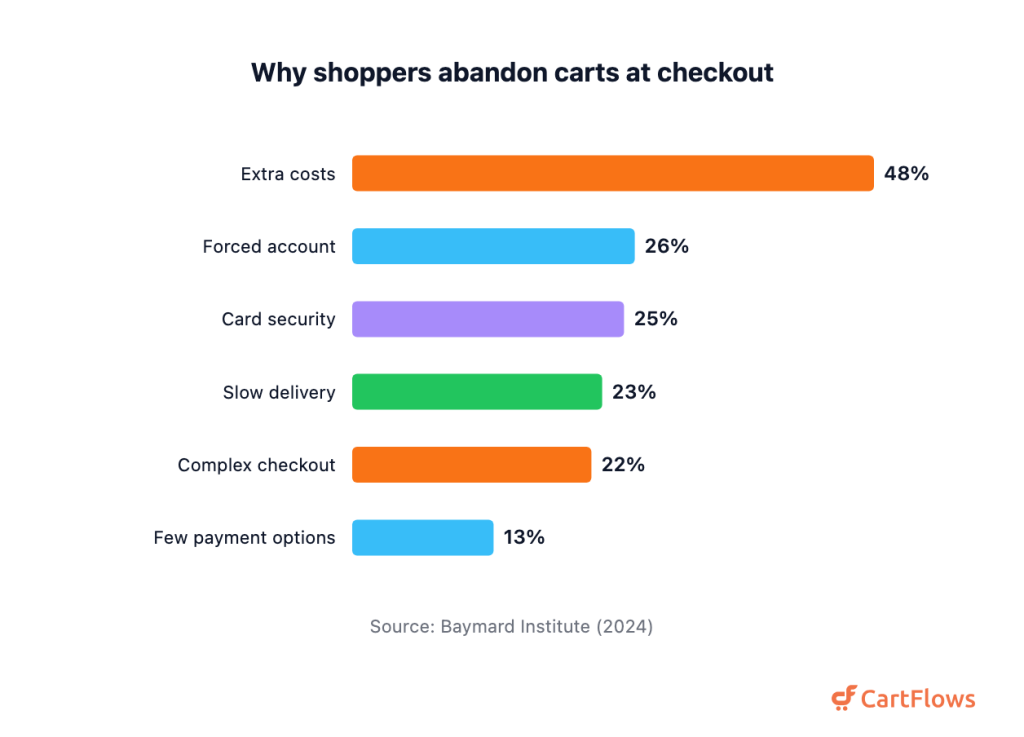
Why shoppers abandon carts at checkout
The reasons above are mostly fixable. Our own ecommerce conversion rate statistics and cart and checkout abandonment statistics dig into the fixes. And cart abandonment recovery wins back some of what’s lost.
Checkout and Payment Methods
In 2024, digital wallets were the most-used way to pay online, handling 53% of global ecommerce transaction value.[5] Cards haven’t disappeared. They’ve mostly moved inside the wallets.
- In 2024, digital wallets handled 53% of global ecommerce payments, projected to reach 65% by 2030.[5]
- Direct card use split into credit cards (20%) and debit or prepaid cards (12%).[5]
- BNPL made up about 5% of global ecommerce transaction value and is still growing.[5]
- 56% of consumers fund their wallets with cards, and that rises to 70% in the US.[5]
- Counting wallet card-funding, cards touch 65% of transactions, about $29 trillion in 2024.[5]
- US Gen Z digital-wallet adoption reached 91% in 2025.[25]
- 13% of shoppers abandon a cart when there aren’t enough payment methods.[7]
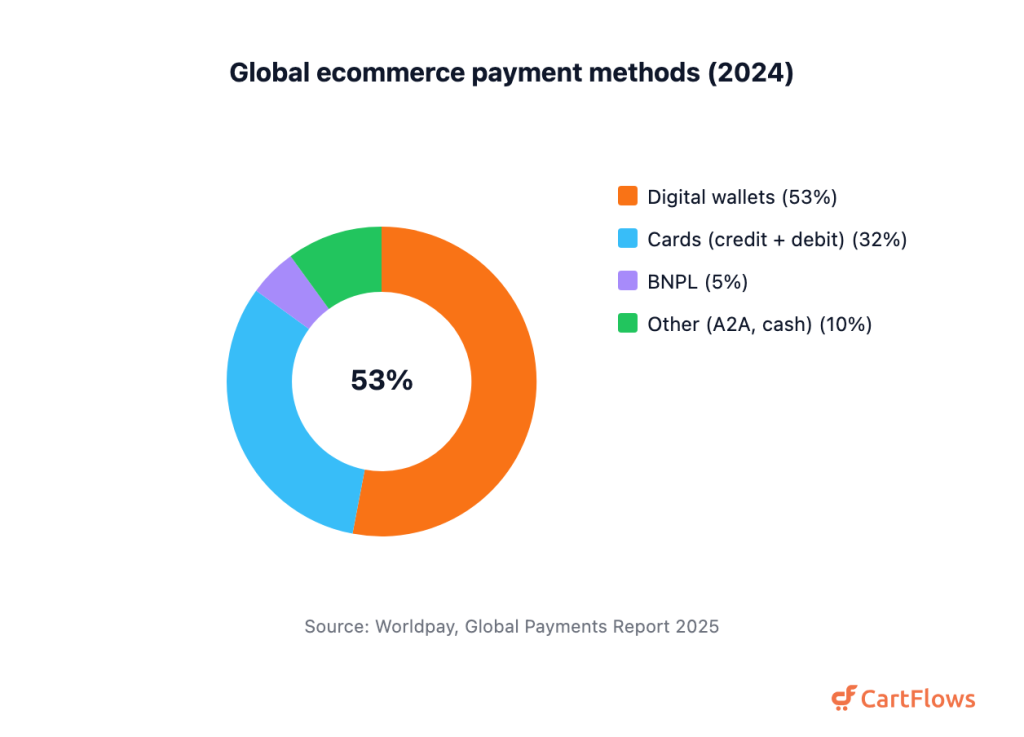
Global ecommerce payment methods (2024)
The takeaway for a store owner is simple. Offer the wallets your buyers already use, keep cards as a backstop, and don’t make anyone hunt for how to pay. That’s core payment gateway optimization.
Ecommerce Returns
In 2025, an estimated 19.3% of US online sales were sent back, well above the in-store rate.[8] Returns are a cost of doing business online. But the policy itself sells, and that’s the twist.
- In 2025, an estimated 19.3% of US online sales were returned.[8]
- Total US retail returns hit $849.9 billion, or 15.8% of sales, in 2025.[26]
- That’s down from $890 billion, or 16.9% of sales, in 2024.[26]
- 82% of shoppers call free returns a major purchase consideration, up from 76%.[26]
- Clothing is the most-returned online category, sent back by 26% of consumers.[27]
Here’s the tension. Free, easy returns win the sale, yet every return eats margin. The stores that handle it well treat the return policy as part of the offer, not an afterthought.
Social Commerce
In 2025, more than half of US social media users made at least one purchase through a social channel.[28] Discovery is where social really earns its keep. But the buying itself usually finishes somewhere else, and that’s fine.
- In 2025, 50.6% of US social media users bought via a social channel.[28]
- US social commerce sales hit $67.06 billion in 2023, on track for $144.52 billion by 2027.[29]
- US adults buy most on Facebook (49%), YouTube (46%), and Instagram (40%).[30]
- The average US social buyer spent $627.80 in 2023, forecast to top $1,220 by 2027.[30]
- 53% of consumers say they discover new products on social media.[31]
Social is a discovery engine first. People find a product in a feed, then they check reviews and prices before they commit.
AI in Ecommerce
In 2025, traffic from generative-AI tools to US retail sites grew 4,700% year over year.[11] It’s a tiny channel that’s growing fast. And the shoppers it sends behave differently.
- In 2025, generative-AI-referred traffic to US retail sites grew 4,700% year over year.[11]
- During the 2024 holiday season, that traffic jumped 1,300% against the prior year.[32]
- On Cyber Monday 2024, genAI-referred traffic spiked 1,950%.[32]
- 38% of US consumers have used generative AI while shopping online.[11]
- Top AI uses are product research (53%) and recommendations (40%).[11]
- AI-referred shoppers show 27% lower bounce and 32% longer visits.[11]
- More than 80% of retailers are already using or piloting generative AI.[33]
The share of sales is still small, so don’t over-rotate. But the engagement numbers say these visitors arrive with clearer intent, and that’s worth designing for.
Holiday and Seasonal Shopping
In 2025, US shoppers spent a record $257.8 billion online during the holiday season, up 6.8% on the year.[9] The peak days keep breaking records. And buyers now lean on flexible payments, because they’re stretching budgets.
- In 2025, US holiday online spend reached a record $257.8 billion, up 6.8% YoY.[9]
- Cyber Monday was the biggest online day ever at $14.25 billion, up 7.1%.[34]
- Black Friday hit $11.8 billion online, up 9.1%, its first time above $11 billion.[34]
- Cyber Week, the five days from Thanksgiving to Cyber Monday, drove $44.2 billion online.[34]
- BNPL drove a record $1.03 billion on Cyber Monday alone.[34]
- Mobile carried about 53% of holiday online spend.[34]
- Year over year, Cyber Monday rose from about $13.3 billion (2024) to $14.25 billion, and Black Friday from about $10.8 billion to $11.8 billion.[34]
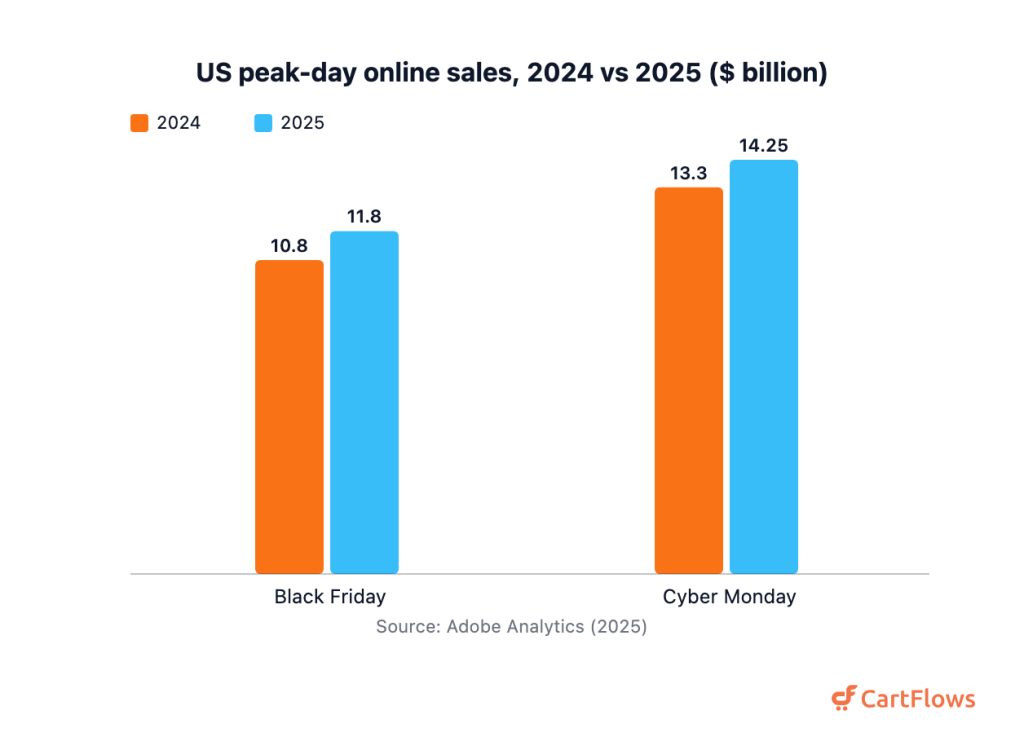
US peak-day online sales, 2024 vs 2025 ($ billion)
The holidays reward stores that prepped early. Fast pages, saved payment methods, and clear shipping cutoffs are what convert a spike in traffic into a spike in orders.
Top Retailers and Market Share
In 2025, Amazon captured 40.9% of all US retail ecommerce sales, more than $540 billion.[10] No rival comes close. There isn’t a second place worth naming.
- In 2025, Amazon held 40.9% of US retail ecommerce, about $540.29 billion.[10]
- Walmart was a distant second, with $93.86 billion in US online sales.[35]
- 73% of Americans shopped on Amazon in 2024.[36]
- By monthly visits, the top US sites are Amazon (2.08 billion), eBay (543.8 million), and Walmart (492.7 million).[37]
- Walmart’s 7.1% leaves the rest of the market splitting about 52% of US ecommerce.[10]
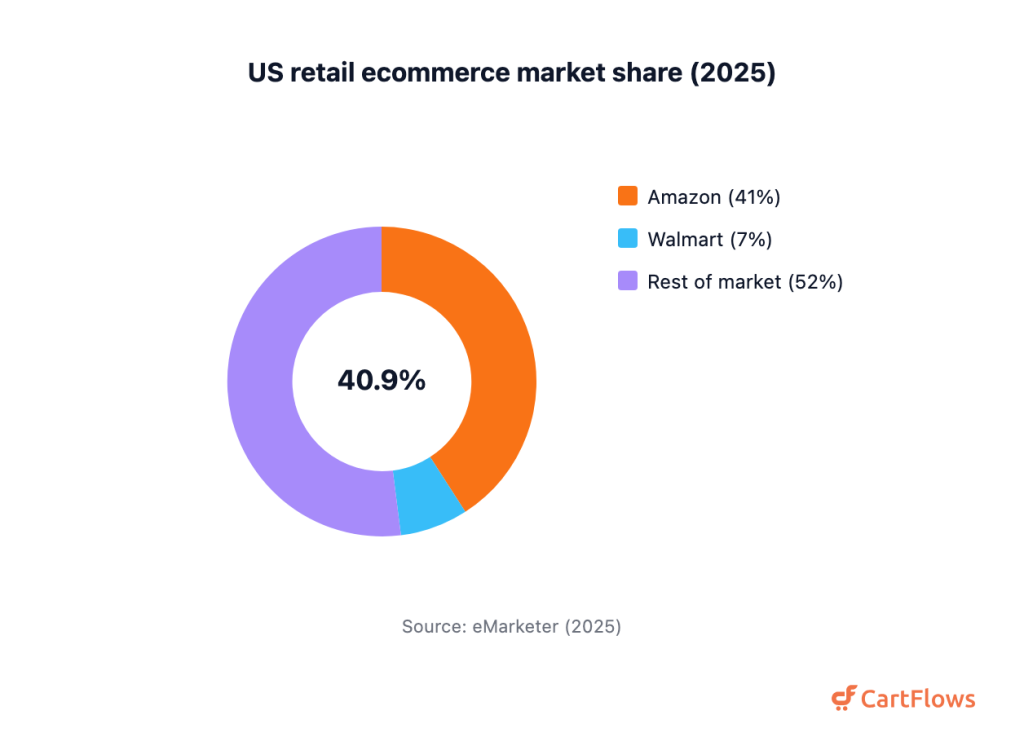
US retail ecommerce market share (2025)
For independent stores, the lesson isn’t to fight Amazon on scale. It’s to own the parts of the journey a marketplace can’t, like brand, offers, and a funnel built for conversions.
Ecommerce Fraud and Trust
In 2023, online payment fraud cost merchants an estimated $48 billion worldwide.[38] The losses aren’t spread evenly. Some regions get hit far harder than others.
- In 2023, global online payment fraud losses reached about $48 billion.[38]
- Cumulative fraud losses from 2023 to 2027 are forecast above $343 billion.[38]
- Latin America loses the most to fraud, at 4.2% of ecommerce revenue.[39]
- Europe (3.1%), Asia Pacific (2.9%), and North America (2.4%) follow.[39]
Trust is a conversion lever, not just a security line item. Clear payment options and a checkout that looks safe help shoppers finish the sale.
Sources and Methodology
We built this page from primary sources wherever we could reach them.
Government data came from the US Census Bureau and the International Trade Administration. Industry benchmarks came from Dynamic Yield, Baymard Institute, Adobe Analytics, Worldpay, NRF, and NVIDIA. Market research came from eMarketer, Statista, DataReportal, and Grand View Research. Each stat carries a numbered citation that links to its source below.
We also traced aggregator numbers back to the original publisher. If we couldn’t verify a figure, or the primary contradicted it, we dropped it. We cut a stale buy-now-pay-later number once its source turned out to be a newer, differently-scoped model. We corrected an AI-adoption stat to the 38% Adobe actually reports.
Figures are current as of July 2026 and reflect the freshest release from each source. Where a forecast vintage mattered, we kept to a single series so the numbers don’t clash.
Final Thoughts
The numbers tell a clear story. Ecommerce keeps growing, but the easy gains are gone. Traffic costs more, phones now carry most of it, and shoppers bail the moment checkout feels slow or expensive.
So the edge isn’t more visitors. It’s turning the ones you have into buyers. The stores that win in 2026 sweat the boring details, like shipping clarity, a short checkout, and a mobile flow that just works. That’s unglamorous work. It’s also where the money is.
Frequently Asked Questions
References
1. eMarketer
4. Statista
5. Worldpay
8. NRF
10. eMarketer
11. Adobe Analytics
12. International Trade Administration
13. BuiltWith
14. DataReportal
15. DataReportal
16. DataReportal
17. eMarketer
18. PYMNTS
19. eMarketer
20. eMarketer
21. eMarketer
23. ecommerceDB
24. Portent
25. Billtrust
26. NRF
28. eMarketer
29. eMarketer
30. eMarketer
31. Salesforce
32. Adobe Analytics
33. NVIDIA
34. Adobe Analytics
35. eMarketer
37. eMarketer
38. Juniper Research
39. Statista