



In 2026, the documented online cart abandonment rate sits at 70.22%, based on a meta-analysis of 50 studies. That’s roughly 7 in 10 filled carts abandoned. This page collects 65+ primary-sourced statistics: why shoppers leave, how rates split by device, industry, and region, the revenue at stake, and which recovery channels actually work.
Key Statistics (at a Glance)
- In 2026, the documented average cart abandonment rate across 50 studies was 70.22%.[1]
- The live global cart abandonment average over the trailing 12 months of 2026 reached 77.54%.[2]
- In 2026, 40% of shoppers abandoned carts because extra costs like shipping, tax, and fees ran too high, the top fixable reason.[1]
- In 2026, mobile devices had the highest cart abandonment rate of any device, at 79.92%.[2]
- In 2025, the average US checkout displayed 23.48 form elements by default, well above the ideal of 12–14.[1]
- In 2025, an estimated $260 billion in lost orders is recoverable across the US and EU through better checkout design.[1]
- In 2025, improved checkout design can raise conversions by an average of 35.26% on large sites.[1]
- In 2023, abandoned-cart email was the highest-converting recovery flow type, at a 3.33% placed-order conversion rate.[3]
- Abandoned-cart SMS posted a 42.02% click-to-conversion rate in 2025, a standout among recovery channels.[4]
- Key Statistics (at a Glance)
- Overall Cart Abandonment Rate
- Why Shoppers Abandon Their Carts
- Checkout Friction and Form Fields
- Cart Abandonment by Device
- Cart Abandonment by Industry
- Cart Abandonment by Region
- The Financial Impact of Cart Abandonment
- Cart Recovery Benchmarks (Email, SMS, Retargeting, BNPL)
- Seasonal and Holiday Abandonment
- Sources and Methodology
- Final Thoughts
- Frequently Asked Questions
- References
Overall Cart Abandonment Rate
In 2026, the documented cart abandonment rate sits at 70.22%, averaged across 50 independent studies.[1] Live trackers read higher. The trailing 12-month global average is 77.54%.[2] The gap is about method, not behavior.
- In 2026, the documented cart abandonment rate averaged 70.22% across 50 independent studies.[1]
- 77.54% global average over the trailing 12 months.[2]
- 71.72% in a first-half 2025 study.[5]
- 79.53% in an own-traffic study.[1]
- 68.70% in the Real-Time Marketing Report.[1]
- Monthly rates ranged from a high of 80.17% in September 2025 to a low of 72.89% in December 2025.[2]
- 78.5% in the most recent month, June 2026.[2]
- 79.30% in a Q4 benchmark report.[1]
- 84.27% in an ecommerce stats report.[1]
- Back in 2010, the rate sat near 55.00%, an early anchor point.[1]
One figure rarely captures it here. What stands out is how flat the average’s stayed. Behavior isn’t shifting; the friction just isn’t getting fixed.
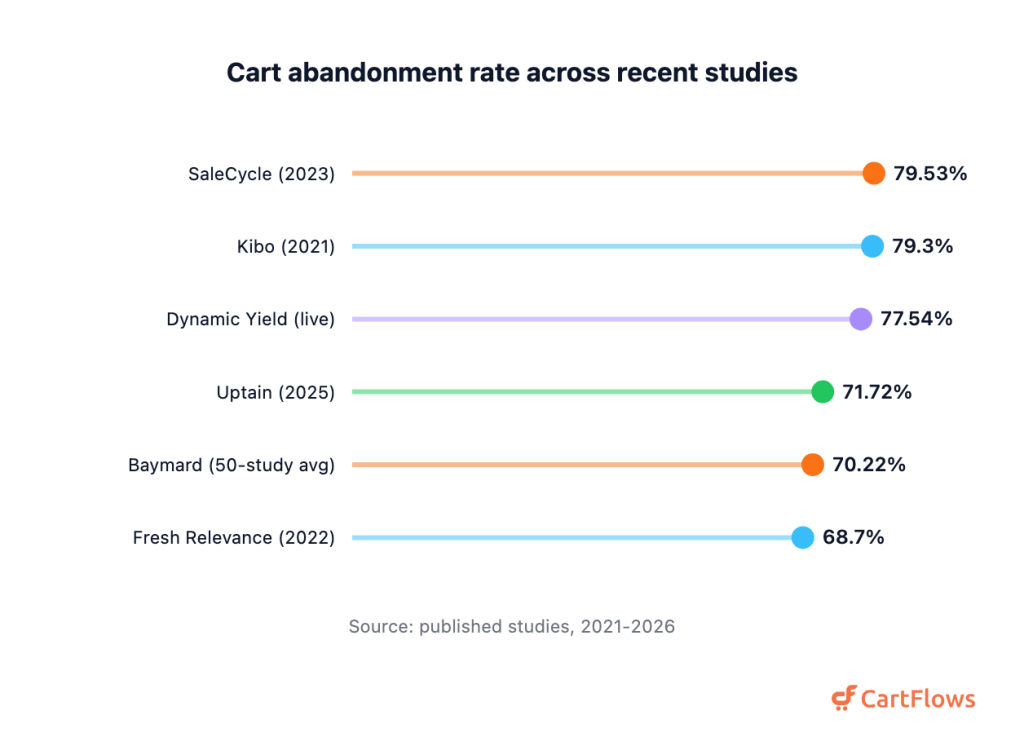
Documented abandonment rates cluster near 70% across independent studies. Baymard’s 70.22% is a meta-average of 50 studies.
Why Shoppers Abandon Their Carts
In 2026, the top reason people abandon isn’t price. It’s intent. In a survey of 1,083 US adults, 42% said they abandoned carts because they were just browsing and weren’t ready to buy.[1] Among fixable reasons, extra costs led at 40%.[1]
- In 2026, 42% of US shoppers said they abandoned carts because they were just browsing or not ready to buy.[1]
- 40% left because extra costs like shipping, tax, and fees ran too high.[1]
- 20% said delivery was too slow.[1]
- 19% didn’t trust the site with their card details.[1]
- 18% were forced to create an account.[1]
- 17% found the checkout too long or complicated.[1]
- 17% hit website errors or a crash.[1]
- 13% weren’t satisfied with the return policy.[1]
- 12% couldn’t see or calculate the total cost upfront.[1]
- 10% had their card declined.[1]
- 9% didn’t have enough payment methods.[1]
- Separately, unexpected fees including shipping drove 55% of abandonment.[2]
If forced accounts and surprise fees keep costing you sales, our guide to reduce cart abandonment in WooCommerce covers the fixes we’d tackle first.
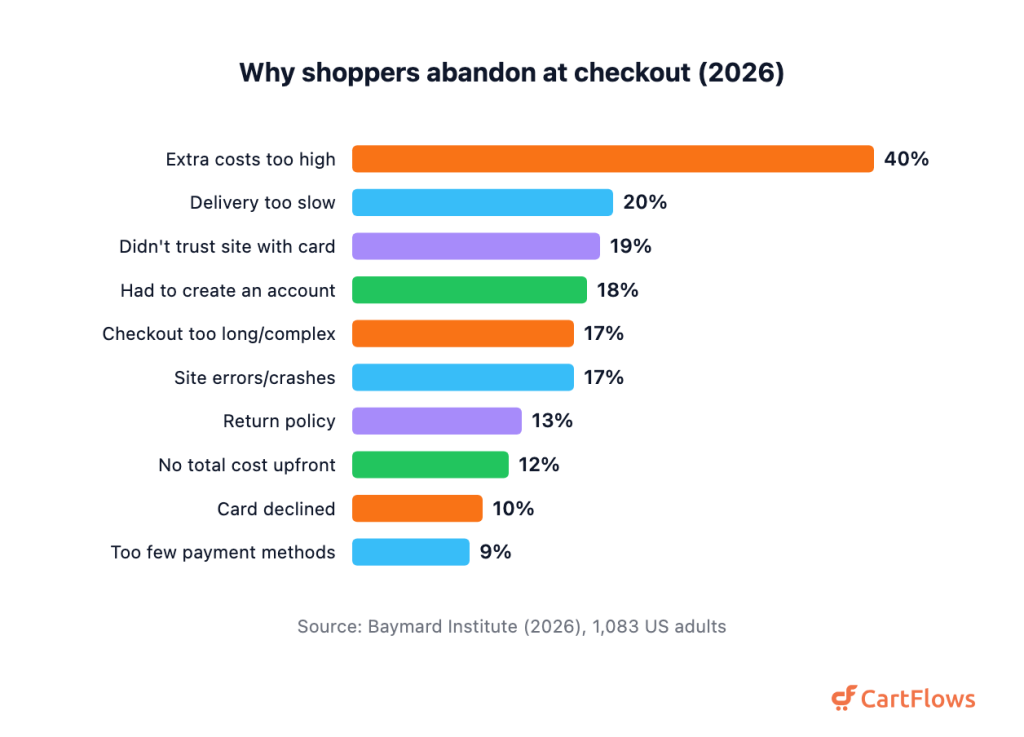
Reasons US shoppers gave for abandoning a checkout, excluding “just browsing.” Source: Baymard Institute (2026).
Checkout Friction and Form Fields
In 2025, the average US checkout showed 23.48 form elements by default, close to double the ideal of 12–14.[1] Longer flows cost conversions. There’s plenty of room to trim, too: most checkouts could cut form elements by 20–60%.[6]
- In 2025, the average US checkout showed 23.48 form elements by default, or 14.88 counting only fields.[1]
- The ideal is 12–14 elements (about 13), or 7–8 if you count only form fields (about 7.5).[1]
- Most checkouts could cut form elements by 20–60%.[6]
- There are 140 distinct documented causes of checkout usability problems.[1]
- Audited sites averaged 39 potential improvement areas each across 60 sites.[1]
- The average flow runs 5.1 steps.[6]
- It also carries about 11.3 form fields.[6]
- Every 0.1s of load-time improvement can lift retail conversions by 8.4%.[7]
That’s the case for an optimized checkout that trims fields, and a one-page checkout that collapses those steps into a single screen.
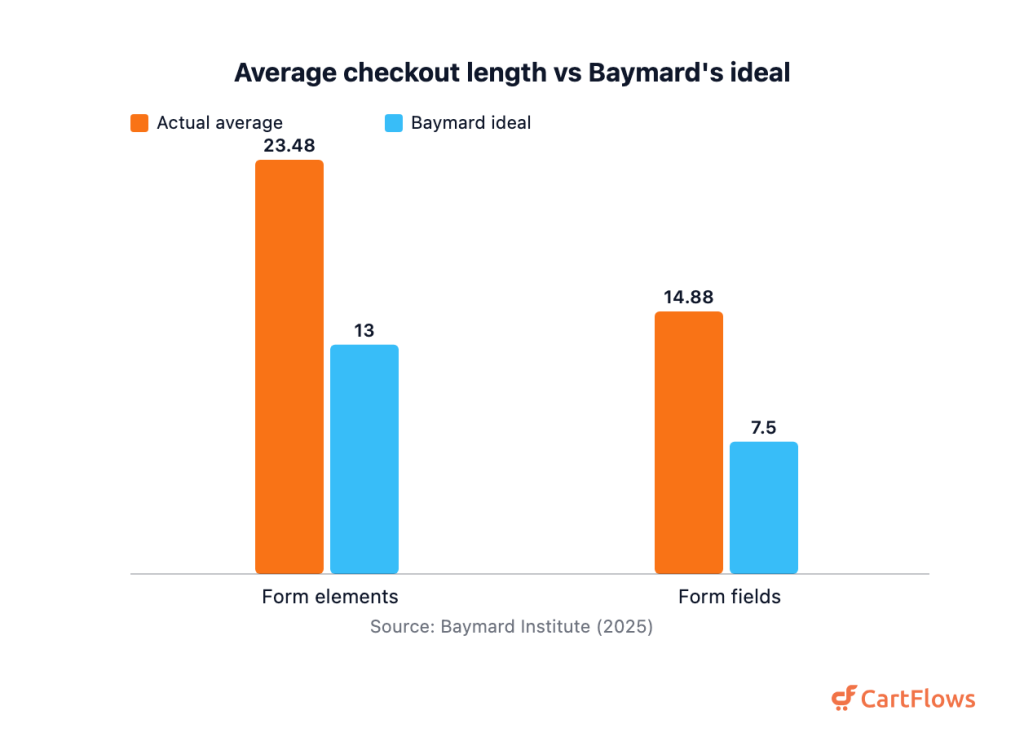
US checkouts show far more form elements than Baymard’s tested ideal. Source: Baymard Institute (2025).
Cart Abandonment by Device
In 2026, mobile had the highest cart abandonment rate of any device at 79.92%, versus 69.19% on desktop.[2] Tablets land between at 72.31%. Mobile also pulls the most traffic, so that gap doesn’t stay small for long.
- In 2026, mobile devices had the highest cart abandonment rate of any device, at 79.92%.[2]
- Tablet 72.31%.[2]
- Desktop 69.19%, the lowest of the three.[2]
- In the UK, mobile abandonment runs near 77%.[8]
- Across the EU and UK, mobile frequently exceeds 85%.[8]
Mobile behaves differently. That’s why mobile checkout optimization often pays off faster than almost any other fix.
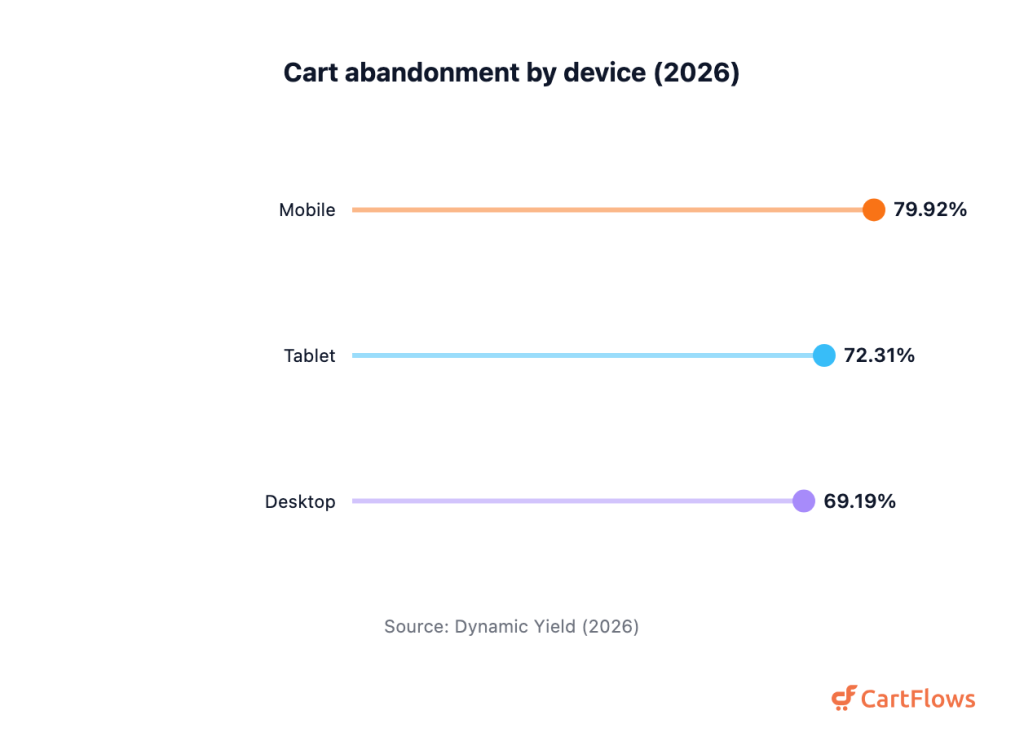
Mobile carts are abandoned far more often than desktop. Source: Dynamic Yield (2026).
Cart Abandonment by Industry
In 2026, beauty and personal care topped the trailing 12-month abandonment benchmark at 79.81%, while pet care and veterinary sat lowest at 51.1%.[2] High-consideration categories lose the most carts. Everyday essentials don’t.
- In 2026, beauty and personal care led all verticals on the trailing 12-month benchmark at 79.81%.[2]
- Pet care and veterinary is lowest at 51.1%.[2]
- Food and beverage spiked to 80.94% in June, the month’s highest vertical.[2]
- Cruise and ferry bookings top the sector chart near 98%.[8]
Cart Abandonment by Region
In 2026, Asia Pacific records the highest regional abandonment on the live benchmark at 81.21%, while the Americas sits lowest at 74.46%.[2] Payment infrastructure and delivery reliability drive most of the spread, and they’re far from uniform across markets.
- In 2026, Asia Pacific recorded the highest regional cart abandonment on the live benchmark at 81.21%.[2]
- EMEA 79.17%.[2]
- The Americas 74.46%, the lowest region.[2]
- France mobile runs near 88%, with desktop near 79%.[8]
- Italy sits near 83%.[8]
- Spain runs above 86%.[8]
- UK desktop sits near 69%.[8]
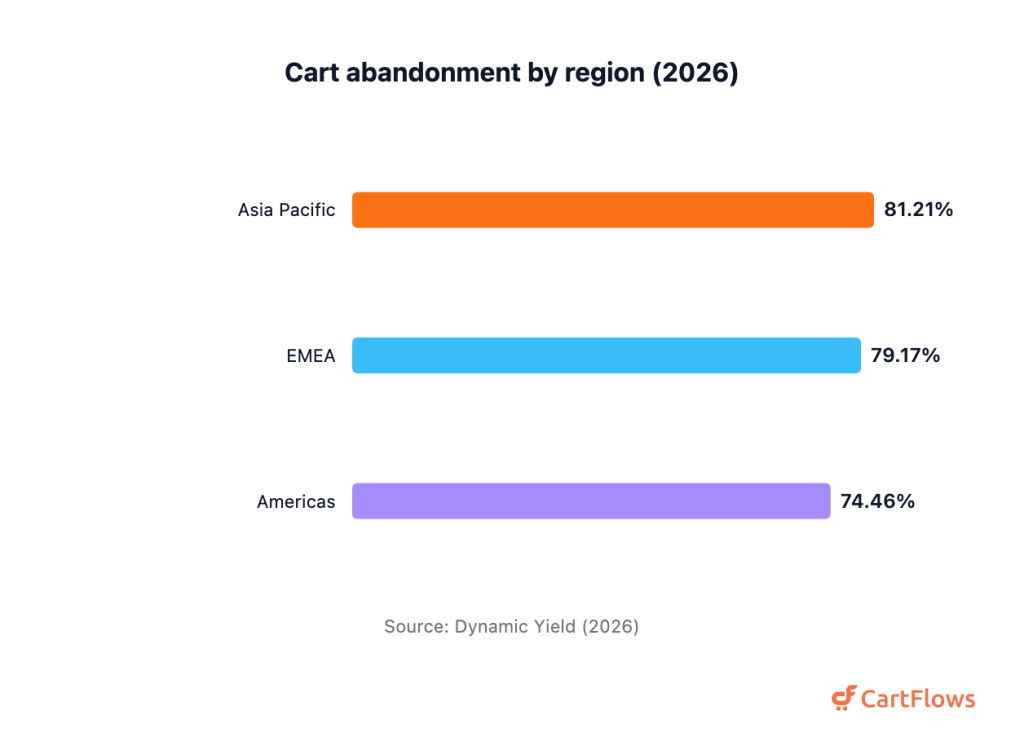
Regional abandonment on live Dynamic Yield traffic, trailing 12 months. Source: Dynamic Yield (2026).
The Financial Impact of Cart Abandonment
Baymard estimates $260 billion in lost orders is recoverable across the US and EU through better checkout design alone.[1] That figure comes from applying a 35.26% checkout-conversion lift to the combined $738 billion US and EU sales base, so it’s real money on the table.
- In 2025, an estimated $260 billion in lost orders is recoverable across the US and EU through better checkout design.[1]
- That figure rests on a combined US and EU sales base of $738 billion.[1]
- Better checkout design can raise conversions by 35.26% on large ecommerce sites.[1]
- A 2019 Forrester estimate put annual US abandonment losses near $18 billion.[9]
- In the UK alone, abandonment costs an estimated £38 billion.[8]
- 1 in 4 shoppers who abandon buy the same product from a competitor.[8]
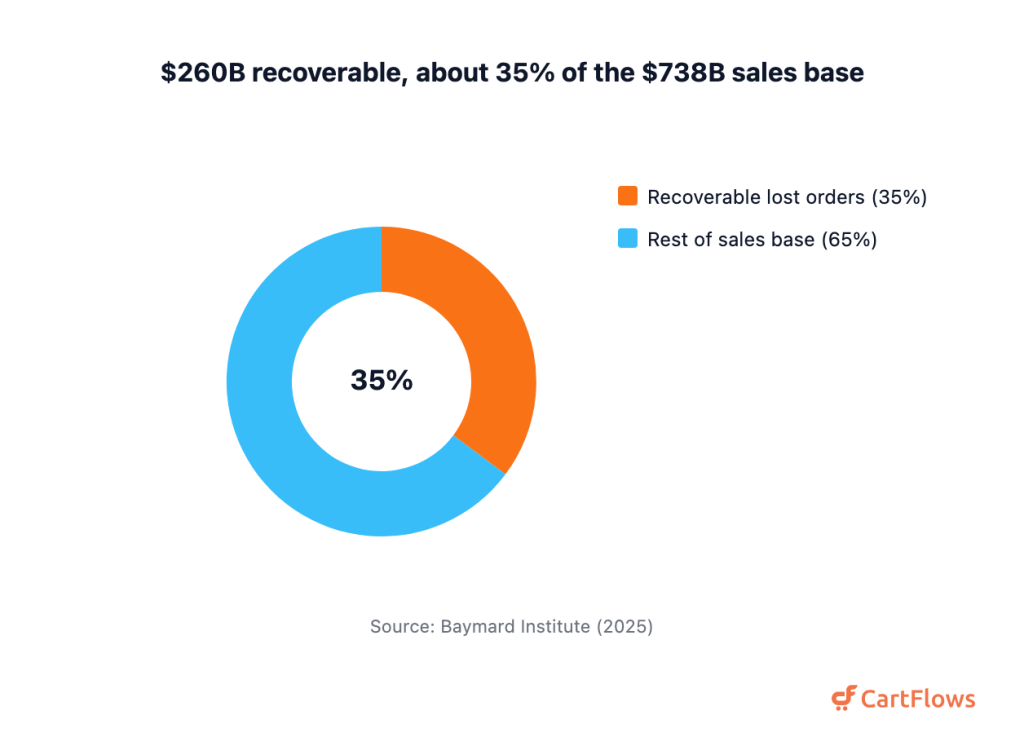
Baymard estimates $260B of lost orders is recoverable through better checkout UX. Source: Baymard Institute (2025).
Cart Recovery Benchmarks (Email, SMS, Retargeting, BNPL)
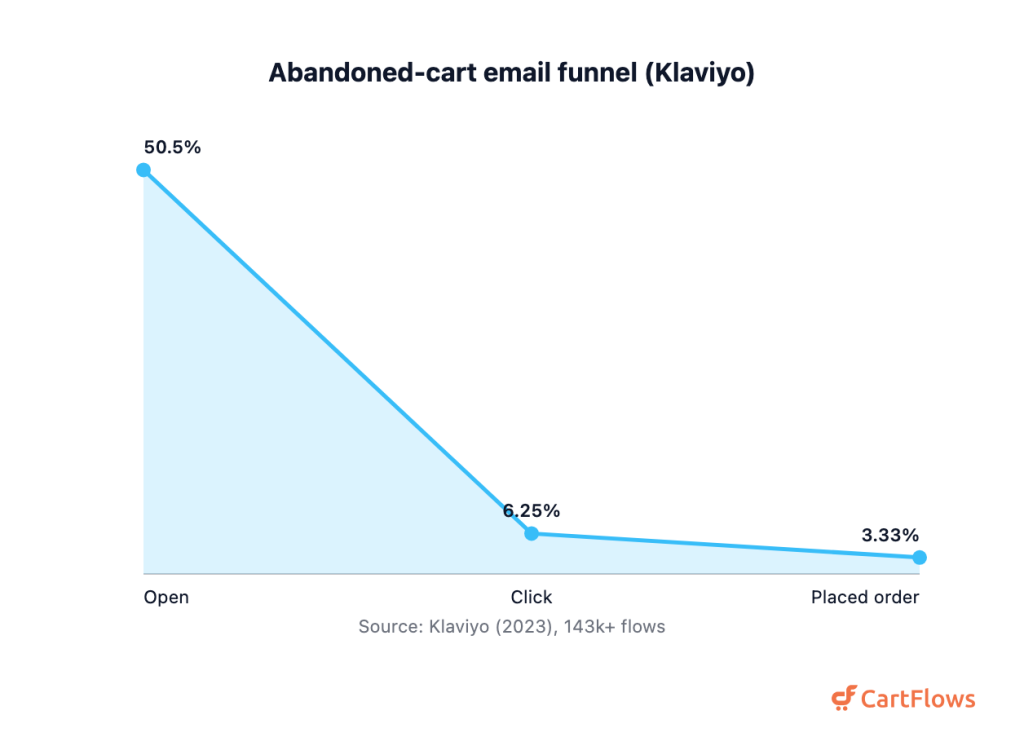
In 2023, abandoned-cart email posted a 3.33% placed-order conversion rate, the highest of any recovery flow type, across more than 143,000 flows.[3] Recipients averaged $3.65 each, and open rates reached 50.5%. Recovery’s where abandoned revenue comes back.
- In 2023, abandoned-cart emails posted a 50.5% open rate across the flows measured.[3]
- Email click rate 6.25%.[3]
- Email placed-order conversion 3.33%, the highest-converting flow type.[3]
- Email revenue per recipient $3.65.[3]
- Top-decile brands convert abandoned-cart email at 7.69%, earning $28.89 per recipient.[3]
- SMS click-to-conversion runs 42.02%, so roughly 2 in 5 clickers buy.[4]
- Abandonment SMS drives 18% of automated orders from just 9% of sends.[4]
- Automated SMS earns $0.74 per send, versus $0.15 for an email campaign.[4]
- Roughly 1 in 3 post-abandonment email clicks lead to a purchase.[2]
- With timely contact, more than 40% of abandoning shoppers return, at an average recovery of 10–15%.[8]
- Retargeting drives 76% higher engagement than standard ads, up to 10x the clicks.[8]
- Shop Pay Installments cut abandoned carts by up to 28%.[10]
- Shop Pay Installments raised average order value by up to 50% across 281 merchants.[10]
We build these plays into Cart Abandonment Recovery for WooCommerce, and you’ll find channel-by-channel tactics in our guide to cart abandonment recovery strategies.
Seasonal and Holiday Abandonment
In 2025, the holiday stretch didn’t behave the way most guides claim. Cart abandonment in November ran 75.87%, and December actually dropped to 72.89%, the lowest of the trailing 12 months.[2] Higher buying intent, not lower, defines the peak season in this data.
- In 2025, cart abandonment in October, just before the holidays, measured 78.38% on the live tracker.[2]
- November abandonment 75.87%, the peak-season month.[2]
- December abandonment 72.89%, the lowest of the last 12 months despite the holiday rush.[2]
So the popular claim that December’s the worst month? The data doesn’t back it up.
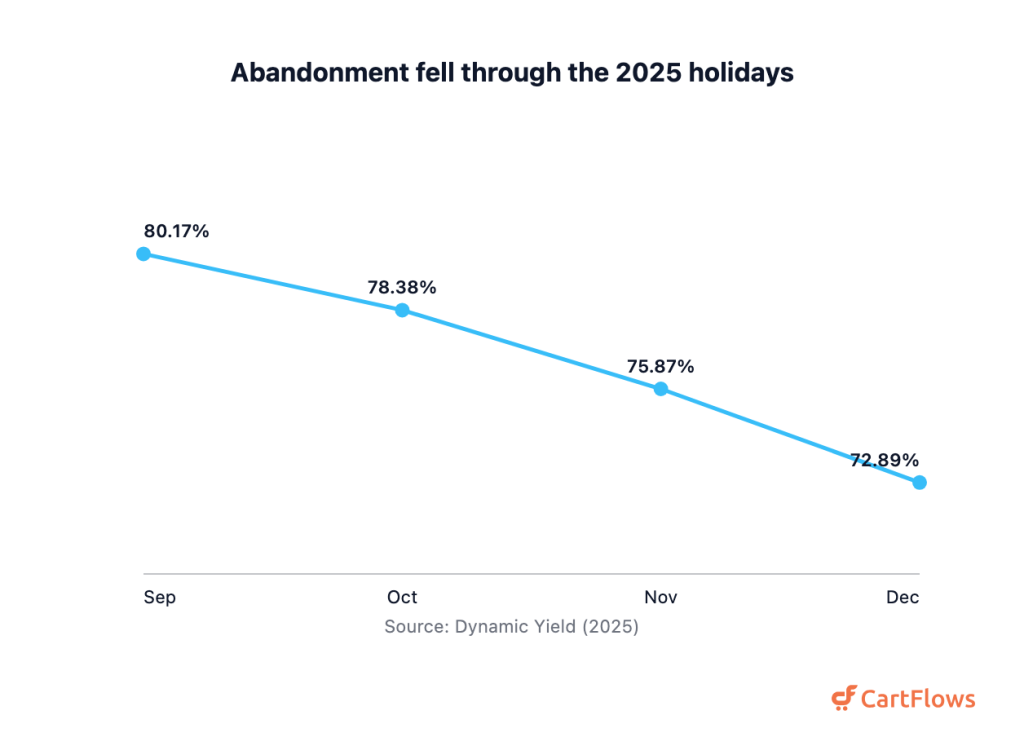
Abandonment dropped as buying intent rose into December 2025, contradicting the common “December is worst” claim. Source: Dynamic Yield (2025).
Sources and Methodology
We compiled these statistics from primary research pages and live benchmark trackers, then checked every number against the source it came from. Where a blog quoted an upstream study, we traced it to the original publisher. Every statistic on this page links to its original source, and any figure we couldn’t trace to a verifiable primary study was deliberately left out.
Final Thoughts
Here’s what the numbers keep telling us. Cart abandonment isn’t a leak you patch once. It’s a baseline of online retail, hovering around 70% for more than a decade. Plenty of pages still quote the old 69.57% figure as if it were current. It isn’t. The documented average is now 70.22%, and it’s barely moved. So the real edge isn’t chasing a lower headline number. It’s fixing the specific, measurable friction at checkout and winning back the shoppers who leave. Small, unglamorous improvements compound. That’s where the money actually sits.
Frequently Asked Questions
References
5. Uptain, 2025
7. Deloitte, Google, and fifty-five, 2020
9. Forrester, via Dynamic Yield, 2019
10. Shopify, 2026