



In 2026, the global average ecommerce conversion rate sits at 2.74%, measured as completed purchases per visit over a rolling 12 months. That’s the honest 1-3% range most stores live in. This page collects 70+ primary-sourced statistics: conversion rates by industry, device, channel, and region, the funnel drop-off, what a higher rate is worth, and which levers actually move it.
Key Statistics (at a Glance)
- In 2026, the global average ecommerce conversion rate was 2.74% over the trailing 12 months.[1]
- 5.37% Beauty & Personal Care, the highest-converting vertical of 2026.[1]
- 0.71% Luxury & Jewelry, the lowest-converting vertical of 2026.[1]
- In 2026, tablet converted highest at 2.89%, with mobile at 2.86% and desktop at 2.46%.[1]
- In late 2025, conversion peaked in November at 3.32%, the strongest month of the year.[1]
- In 2022, ecommerce conversion fell from 3.05% at a one-second load to 0.67% at four seconds.[2]
- As of 2025, 70.22% of online shopping carts were abandoned, averaged across 50 studies.[3]
- In 2023, the median Shopify store converted 1.4% of visits, with the top 10% clearing 4.7%.[4]
- In 2023, the average Shopify order was worth $85, so small conversion gains move real revenue.[5]
- Key Statistics (at a Glance)
- Overall Average Ecommerce Conversion Rate
- Ecommerce Conversion Rate by Industry
- Conversion Rate by Device
- Conversion Rate by Traffic Source and Channel
- The Ecommerce Conversion Funnel
- What a Higher Conversion Rate Is Worth
- What Improves Ecommerce Conversion Rates
- Seasonal and Holiday Conversion Trends
- Ecommerce Conversion Rate by Region
- Sources and Methodology
- Final Thoughts
- Frequently Asked Questions
- References
Overall Average Ecommerce Conversion Rate
In 2026, the global average ecommerce conversion rate was 2.74% over the trailing 12 months, counting completed purchases per visit.[1] Other panels read lower. The spread comes from method, panel, and geography, not from one being wrong.
- In 2026, the global average ecommerce conversion rate was 2.74% over the trailing 12 months.[1]
- 2.03% average conversion rate in June 2026 on a UK/EU-weighted panel, up about 9.7% from 1.85% a year earlier.[6]
- 1.4% median conversion rate across 2,800 Shopify stores in 2023.[4]
- 3.2% for the top 20% of those stores, and 4.7% for the top 10%.[4]
- 3.32% in November 2025, the year’s high point.[1]
- 2.31% in April 2026, the year’s low point.[1]
- 2.61% in the most recent month, June 2026.[1]
- 5.1% year-over-year drop in overall conversion on the 2026 benchmark.[7]
- 6.1% year-over-year drop on the prior benchmark, Q4 2023 versus Q4 2024.[8]
- 1% revenue growth year over year across core industries, even as conversion softened.[7]
- 99 billion sessions across 6,000+ sites anchor the 2026 benchmark panel.[7]
The honest read? Conversion’s drifting down while revenue holds. Traffic keeps getting pricier, so each visit has to work harder.
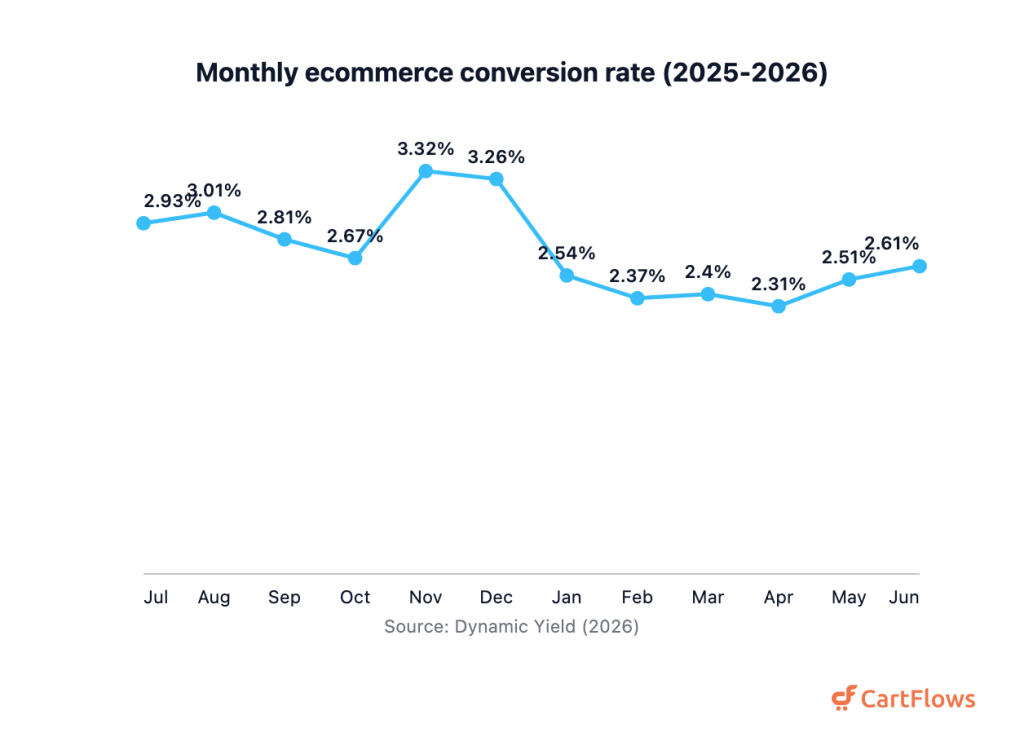
Conversion peaks in the November-December holiday window, then cools into spring. Source: Dynamic Yield (2026).
Month by month, the benchmark ran like this:[1]
| Month | Conversion rate |
|---|---|
| Jul 2025 | 2.93% |
| Aug 2025 | 3.01% |
| Sep 2025 | 2.81% |
| Oct 2025 | 2.67% |
| Nov 2025 | 3.32% |
| Dec 2025 | 3.26% |
| Jan 2026 | 2.54% |
| Feb 2026 | 2.37% |
| Mar 2026 | 2.40% |
| Apr 2026 | 2.31% |
| May 2026 | 2.51% |
| Jun 2026 | 2.61% |
Ecommerce Conversion Rate by Industry
In 2026, Beauty & Personal Care led every ecommerce vertical with a 5.37% average conversion rate, while Luxury & Jewelry trailed at 0.71%.[1] Everyday, low-consideration buys convert fastest. Big-ticket categories don’t, because shoppers deliberate.
- In 2026, Beauty & Personal Care led all verticals at a 5.37% average conversion rate.[1]
- 5.03% Food & Beverage.[1]
- 4.40% Pet Care & Veterinary.[1]
- 3.15% Multi-Brand Retail.[1]
- 2.81% Fashion, Accessories & Apparel.[1]
- 2.43% Consumer Goods.[1]
- 1.20% Home & Furniture.[1]
- 0.71% Luxury & Jewelry, the lowest vertical.[1]
| Industry | Conversion rate (2026) |
|---|---|
| Beauty & Personal Care | 5.37% |
| Food & Beverage | 5.03% |
| Pet Care & Veterinary | 4.40% |
| Multi-Brand Retail | 3.15% |
| Fashion, Accessories & Apparel | 2.81% |
| Consumer Goods | 2.43% |
| Home & Furniture | 1.20% |
| Luxury & Jewelry | 0.71% |
Trailing 12-month averages.[1]
- 5.53% Arts & Crafts, the highest on the UK/EU panel in June 2026.[6]
- 0.51% Baby & Child, the lowest on that same UK/EU panel.[6]
- 1.70% Fashion and 1.31% Food & Drink on the UK/EU panel.[6]
- 1.9% Fashion and 1.5% Food & Beverage among 2023 Shopify verticals.[4]
- 0.2% Travel and 0.2% Finance, the weakest 2023 Shopify verticals.[4]
Notice how the same category ranks differently by panel. Judge yourself against your own vertical, not the global 2.74%.
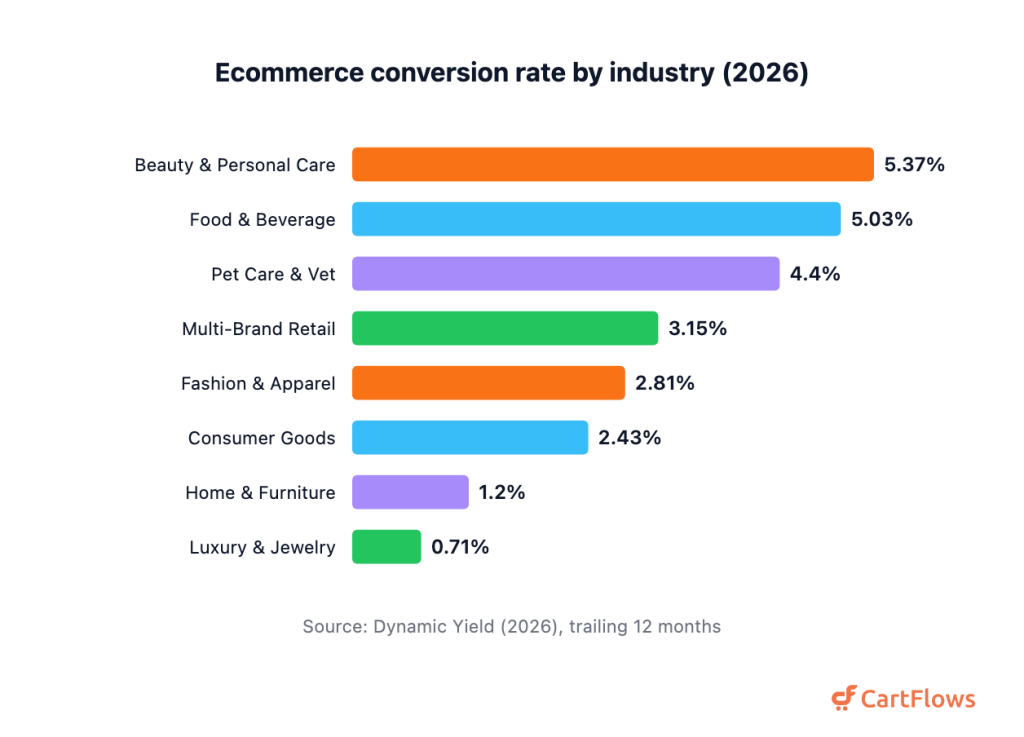
Beauty and food verticals convert roughly seven times better than luxury. Source: Dynamic Yield (2026).
Conversion Rate by Device
In 2026, the device conversion gap nearly closed on live data, with tablet at 2.89%, mobile at 2.86%, and desktop trailing at 2.46%.[1] Most guides still say desktop wins big. On this benchmark, it doesn’t.
- In 2026, tablet converted highest at 2.89% on the live 12-month benchmark.[1]
- 2.86% mobile, essentially level with tablet.[1]
- 2.46% desktop, now the lowest of the three.[1]
- 74% higher desktop conversion than mobile on the broader benchmark, the older pattern.[7]
- 7.9% year-over-year decline in desktop conversion, faster than the overall drop.[7]
- 69.9% of all traffic now comes from mobile.[7]
- 63.50% of ecommerce sales run on mobile on the UK/EU panel.[6]
- 1.9% desktop versus 1.2% mobile in the 2023 Shopify device split.[4]
- 6.5% top-decile desktop versus 3.9% top-decile mobile in 2023.[4]
So which reading is right? Both. Older panels still show a desktop lead, but the live gap has shrunk to almost nothing. That’s why mobile checkout optimization now pays back faster than it used to.
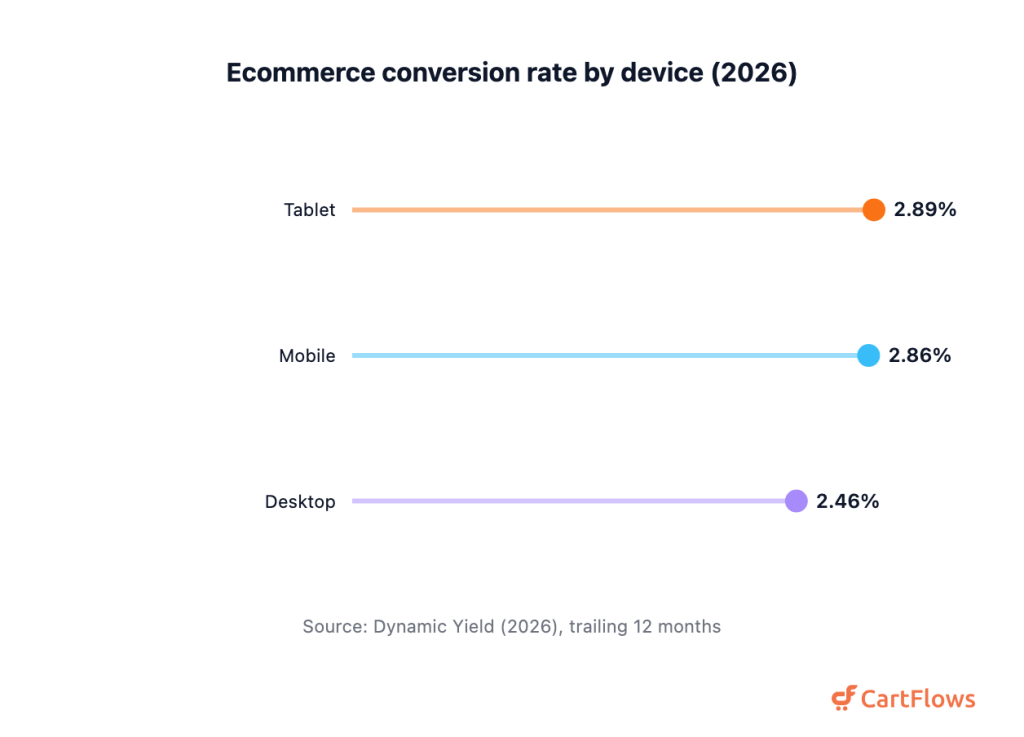
On live 2026 data the device gap has nearly closed, with mobile now matching desktop. Source: Dynamic Yield (2026).
Conversion Rate by Traffic Source and Channel
In 2026, AI-referred visits and paid search converted better than any other channel, at 5.8% and 5.4% across a 110-million-session dataset.[9] These are cross-industry marketing conversions across all industries, counting both leads and sales, so they read higher than pure checkout rates.
- In 2026, the all-channel average conversion rate was 5.13% across 110M+ sessions and 13 industries.[9]
- 5.8% AI referral, the top channel.[9]
- 5.4% paid search.[9]
- 4.9% organic search and 4.9% email.[9]
- 4.8% referral and 4.7% direct.[9]
- 2.23% organic social and 2.11% paid social, the weakest channels.[9]
- 2.8% paid search, the highest paid channel in a retail-specific view.[7]
- 1.3% AI-referred retail conversion, up 55% year over year.[7]
- 0.7% organic social in that retail-specific view.[7]
- 2.9% conversion for returning visitors versus 1.7% for new visitors.[7]
- About 3.3x the placed-order rate from email flows versus one-off campaigns, at 5.58% versus 1.69%.[10]
One takeaway stands out. Social sends traffic, not buyers. Search and email do the closing, and returning visitors nearly double new ones.
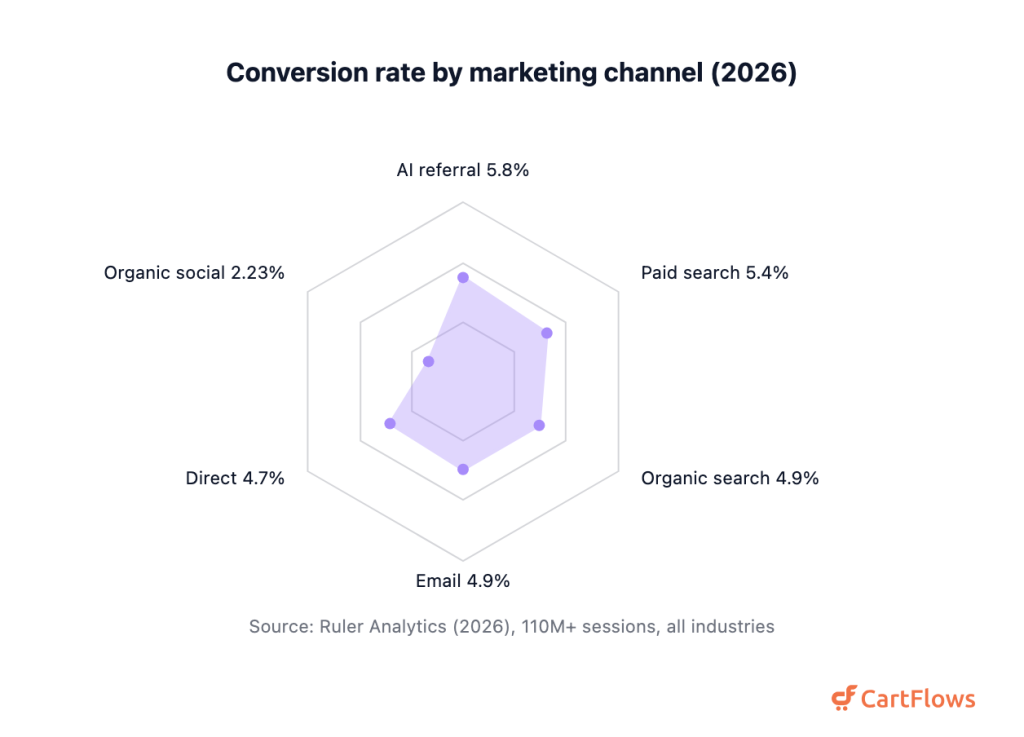
AI-referred and paid-search visits convert best; social lags. Cross-industry data (lead + sale). Source: Ruler Analytics (2026).
The Ecommerce Conversion Funnel
Across 2,800 Shopify stores, the median store turned 4.6% of visits into add-to-carts and just 1.4% into purchases, so most drop-off happens between the cart and the payment.[4] The checkout is where sales leak, and that’s the stage worth fixing first.
- In 2023, the median add-to-cart rate was 4.6%, with the top 20% above 7.5% and the top 10% above 9.6%.[5]
- 1.4% median conversion rate, with the top 20% above 3.2% and the top 10% above 4.7%.[5]
- 70.22% of online carts are abandoned, averaged across 50 studies.[3]
- 35.26% average conversion lift from better checkout design on large sites.[3]
- 23.48 form elements in the average US checkout (about 14.88 fields), against an ideal of just 12-14 elements (roughly 7 to 8 fields).[3]
- 40% of shoppers abandon over extra costs, the top fixable reason.[3]
- 18% leave over forced account creation.[3]
- 17% leave because the checkout ran too long.[3]
If you want the full path from click to purchase, our ecommerce sales funnel guide maps each stage. A one-page checkout collapses those steps and trims the field count that drives so much of the leak.
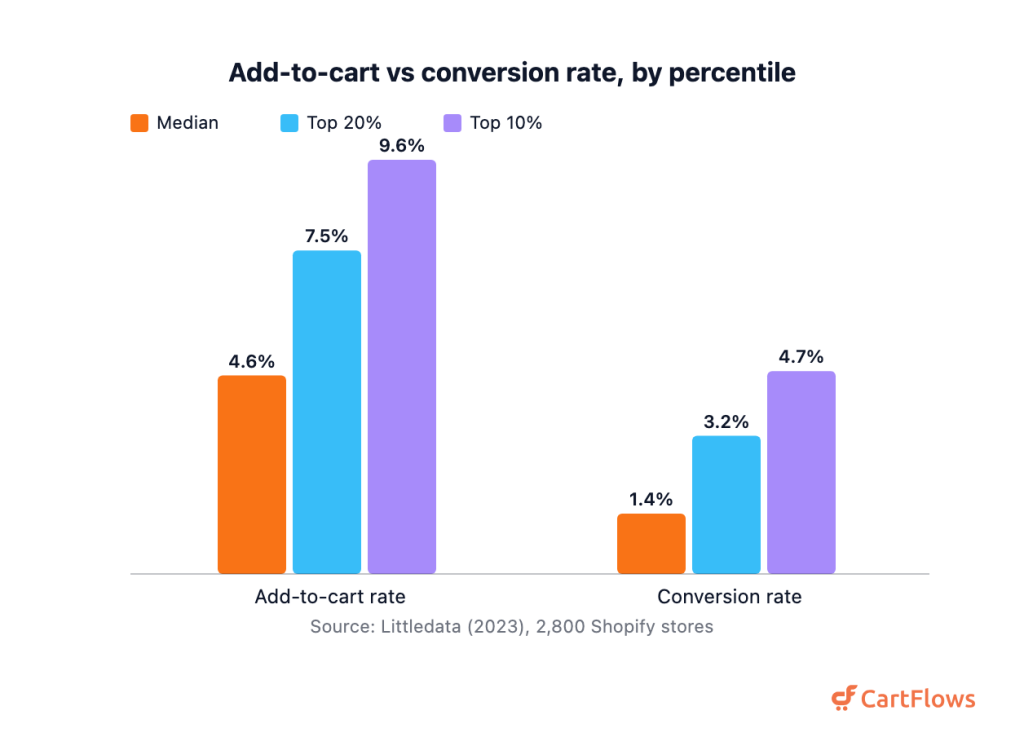
Most drop-off sits between adding to cart and buying. Top stores convert over 3x the median. Source: Littledata (2023).
What a Higher Conversion Rate Is Worth
In June 2026, the average order value on one large panel reached £127.06, up 2.31% year over year.[6] Order values like that are why conversion math matters. You’ve already paid for the visits, so a higher rate just converts more of what you bought.
- In 2023, the average Shopify order value was $85, with the top 20% above $192 and the top 10% above $311.[5]
- $92 average revenue per customer, with the top 20% above $209 and the top 10% above $326.[5]
- 9.2% lift in average order value from a 0.1-second faster mobile site in a retail study.[11]
- 9% rise in cost per visit in a single year, and 19% over two years.[8]
- £127.06 average order value on the UK/EU panel in June 2026, up 2.31% year over year.[6]
The math nobody loves is simple. Acquisition keeps getting more expensive. So an optimized checkout that lifts conversion is often cheaper than buying more traffic.
What Improves Ecommerce Conversion Rates
In 2022, ecommerce conversion fell from 3.05% at a one-second load time to 0.67% at four seconds, the steepest controllable lever on this page.[2] Speed isn’t a nice-to-have. It’s the difference between three sales and one.
- In 2022, ecommerce conversion measured 3.05% at a one-second load, 1.68% at two seconds, 1.12% at three, and 0.67% at four.[2]
- Roughly 4.6x higher conversion at a one-second load versus four seconds, at 3.05% versus 0.67%.[2]
- 8.4% retail conversion lift from a 0.1-second mobile speed gain.[11]
- 270% higher purchase likelihood for a product with five reviews versus none.[12]
- 380% higher likelihood on higher-priced items, and +15% with a verified-buyer badge.[12]
- 75% of US shoppers prioritize free shipping over fast shipping.[13]
- 81% will spend more to hit a free-shipping threshold.[13]
- 40% of visits carry a frustration signal.[8]
- 53% of single-page exits trace back to slow loading.[8]
- >90% of retail traffic goes to A/B testing, more than any other sector.[14]
So where do you start? Fix speed first, then trust, then shipping. Our guide to speed up your WooCommerce store covers the load-time wins, and an A/B testing guide helps you prove each change before you ship it.
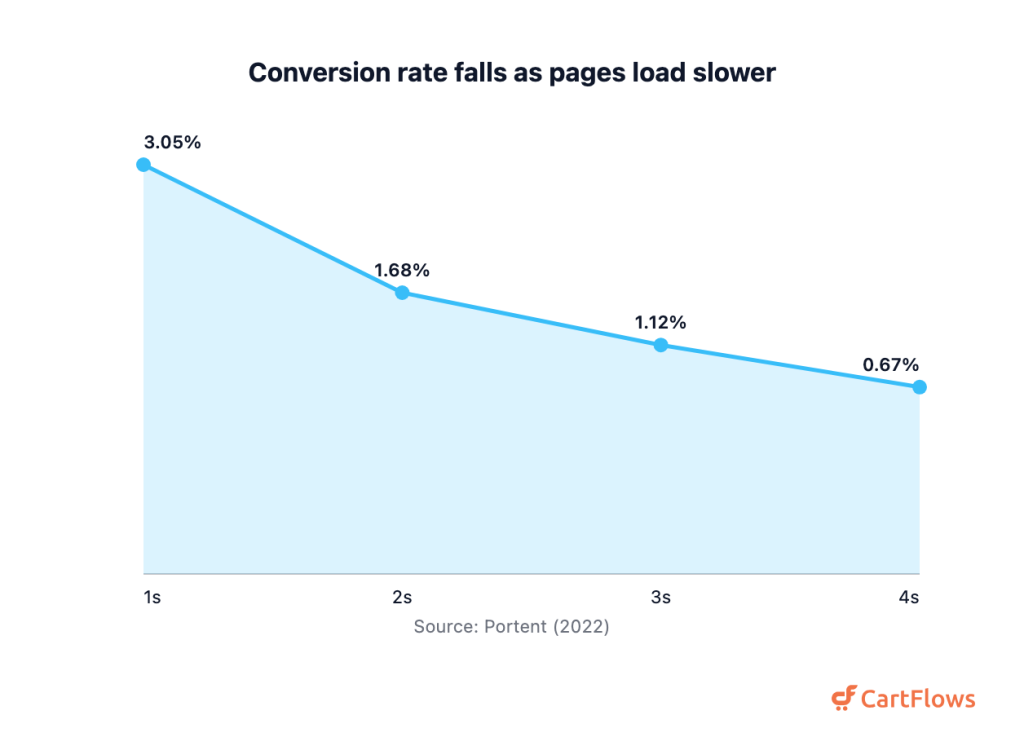
Conversion drops roughly 4.6x, from 3.05% to 0.67%, between a one-second and a four-second load. Source: Portent (2022).
Seasonal and Holiday Conversion Trends
In late 2025, ecommerce conversion peaked rather than cratered, with November at 3.32% and December at 3.26%, both well above the 2.74% annual average.[1] Holiday traffic converts better, not worse. The intent runs higher when people shop to buy.
- In late 2025, November conversion hit 3.32% and December 3.26%, the two strongest months of the year.[1]
- $257.8B in US online holiday spend, up 6.8% year over year and a record.[15]
- $14.25B on Cyber Monday, up 7.1% and the largest online shopping day ever.[16]
- $11.8B on Black Friday, up 9.1%.[15]
- $44.2B across Cyber Week, up 7.7%.[15]
- 56.4% of holiday online sales came from mobile, peaking at 66.5% on Christmas Day.[15]
- $20B in Buy Now Pay Later spend, up 9.8% and a record, with 82.2% of it on smartphones.[15]
- 693.4% year-over-year jump in Gen-AI referral traffic to US retail sites over the season.[15]
The Adobe figures track spend and mobile share, not conversion rate. Read together, though, they tell the same story. Peak season is buying season.
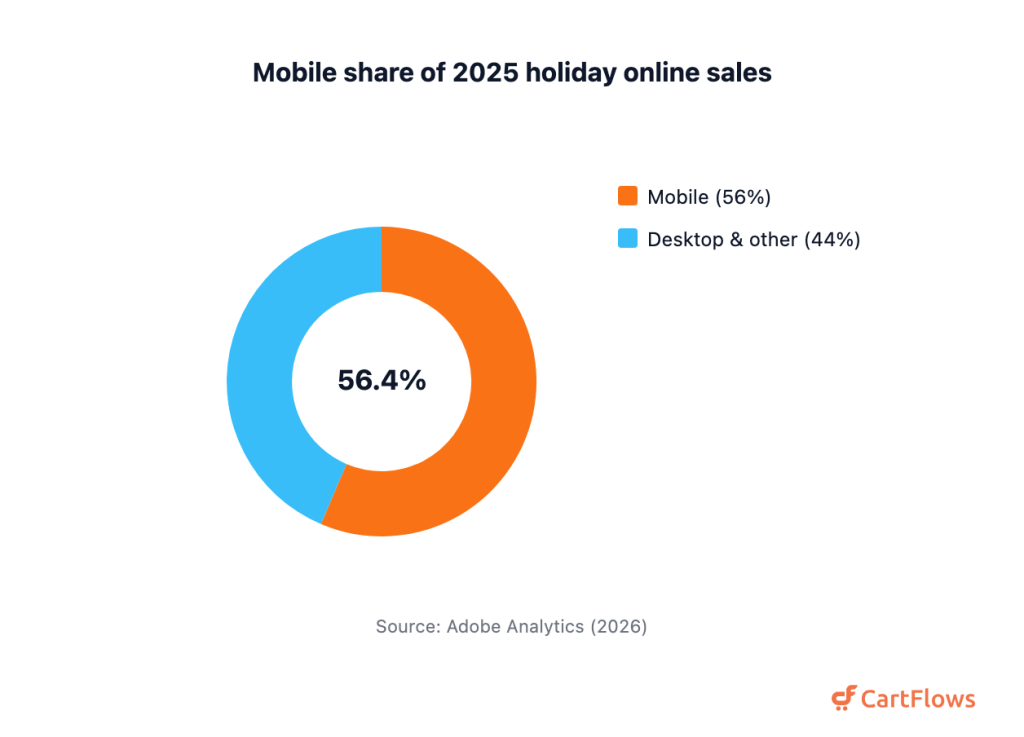
Smartphones drove a record 56.4% of US holiday online sales in 2025. Source: Adobe Analytics (2026).
Ecommerce Conversion Rate by Region
In 2026, EMEA posted the highest regional ecommerce conversion rate at 2.89%, ahead of the Americas at 2.69% and Asia Pacific at 1.58%.[1] Payment habits and delivery reliability drive most of the spread. They’re far from uniform across markets.
- In 2026, EMEA led all regions with a 2.89% conversion rate over the trailing 12 months.[1]
- 2.69% the Americas.[1]
- 1.58% Asia Pacific, the lowest region.[1]
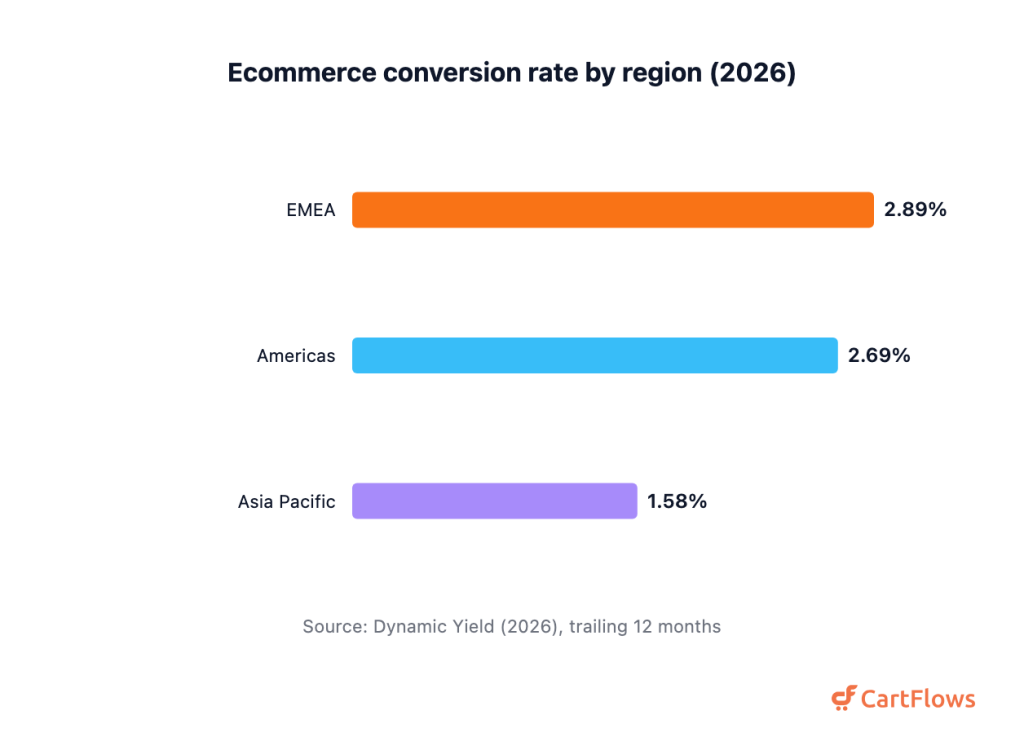
EMEA and the Americas convert well ahead of Asia Pacific on live data. Source: Dynamic Yield (2026).
Sources and Methodology
We compiled these statistics from primary research pages and live benchmark trackers, then checked every number against the source it came from. Where an aggregator quoted an upstream study, we traced it back to the original publisher and cited that. Anything we couldn’t verify on a primary source was dropped, not softened.
Final Thoughts
Here’s what the numbers keep telling us. The average conversion rate isn’t moving much, and it probably won’t. Traffic gets pricier every year, so the real edge isn’t chasing a bigger headline number. It’s converting more of the visitors you’ve already paid for. A lot of the old advice is stale, too. Desktop no longer runs away with it, and the holidays don’t tank your rate. They lift it. Fix the boring stuff, page speed, honest shipping, a short checkout, and you’ll usually beat a rival still waiting for one clever trick to change everything.
Frequently Asked Questions
References
10. Klaviyo, 2026
12. Spiegel Research Center, 2017
13. FedEx, 2024
14. VWO, 2026