


In 2026, a typical website turns about 5.13% of its visitors into leads or sales, and the best-run funnels convert several times that.[1] Most pages on this topic recycle numbers with no source. We didn’t. Here are 100+ sales funnel statistics for 2026, each traced to a named primary source, covering conversion benchmarks, awareness, lead capture, nurturing, closing, tools, and retention.
Key Statistics (at a Glance)
- In 2026, the average website conversion rate across 13 industries was 5.13%.[1]
- The median landing page converts at 6.6%, based on 41,000+ pages and 57 million conversions.[2]
- In 2026, 67% of B2B buyers said they prefer a rep-free, self-serve buying experience.[3]
- The odds of contacting a lead drop 100x when you wait 30 minutes instead of 5.[4]
- The average sales close rate across industries is about 20%.[5]
- 143,664 live websites currently run ClickFunnels, the most-used standalone funnel builder.[6]
- CartFlows is active on 200,000+ WordPress sites, at a 4.8 out of 5 rating.[7]
- A product with five reviews is 270% more likely to be bought than one with none.[8]
- Personalized calls to action convert 202% better than static ones.[9]
- 40% of marketers name lead quality their most important success metric.[10]
- Acquiring a new customer can cost 5 to 25x more than keeping an existing one.[11]
- Key Statistics (at a Glance)
- Sales Funnel Benchmarks
- Conversion Rates by Industry
- Conversion Rates by Channel
- Funnel Stage Conversion Rates
- Top of Funnel: Awareness and Research
- Lead Capture and Landing Pages
- Lead Nurturing and Follow-Up Speed
- Middle of Funnel: Lead Qualification
- Closing: Win and Conversion Rates
- Customer Acquisition Cost by Industry
- Sales Funnel Tools and Automation
- Post-Purchase: Retention and Lifetime Value
- Sources and Methodology
- Final Thoughts
- Frequently Asked Questions
- References
Sales Funnel Benchmarks
In 2026, the average website converts about 5.13% of its visitors, measured across 13 industries and more than 110 million sessions.[1] That’s the honest middle. The gap between an average funnel and a great one is wide, and it’s the whole reason this page exists.
- In 2026, the average website conversion rate across 13 industries was 5.13%.[1]
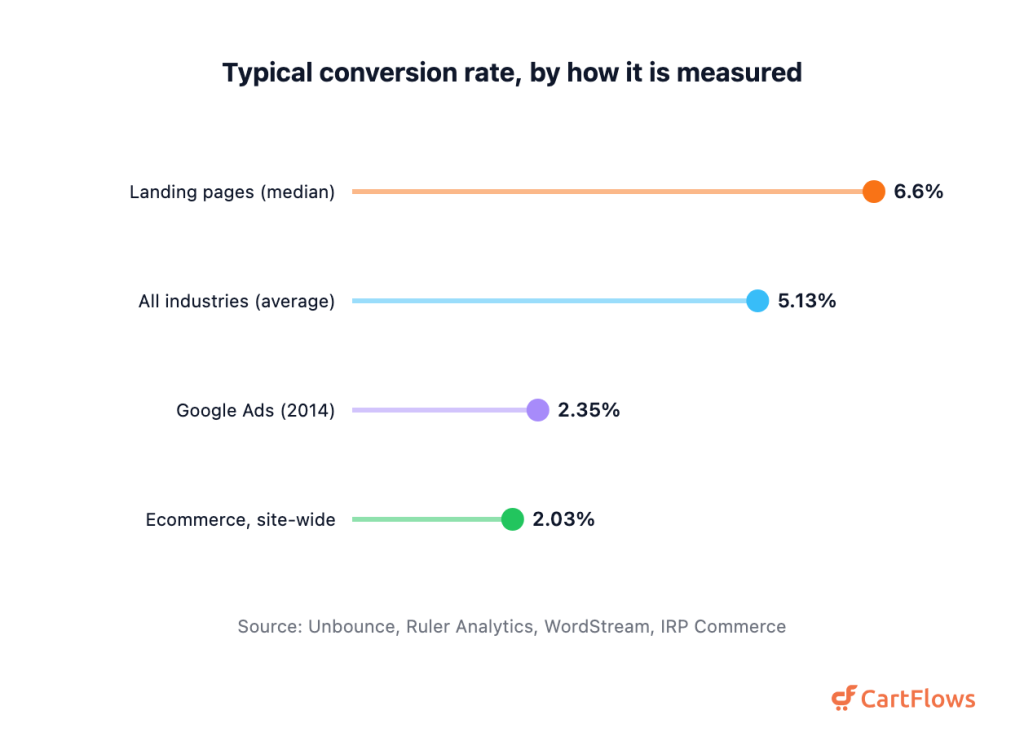
- The median landing page converts at 6.6% across industries.[2]
- In June 2026, the site-wide ecommerce conversion rate was 2.03%.[12]
- Ecommerce conversion rose +9.74% year over year, from 1.85% in June 2025 to 2.03% in June 2026.[12]
- The classic Google Ads benchmark put the median conversion rate at 2.35% back in 2014.[13]
- In that same dataset, the top 25% of accounts converted at 5.31% or higher.[13]
- The top 10% of accounts converted at 11.45% or higher, nearly five times the median.[13]
Typical conversion rate, by how it is measured
One note on those numbers. They measure different things, so they won’t ever line up. A landing page median (6.6%) is not the same as a whole-site ecommerce rate (2.03%), and the old 2.35% Google Ads figure is a decade old now. We’d anchor on the fresh Unbounce and Ruler data and treat the 2014 numbers as history. For the wider retail picture behind that ecommerce rate, see our ecommerce statistics.
Conversion Rates by Industry
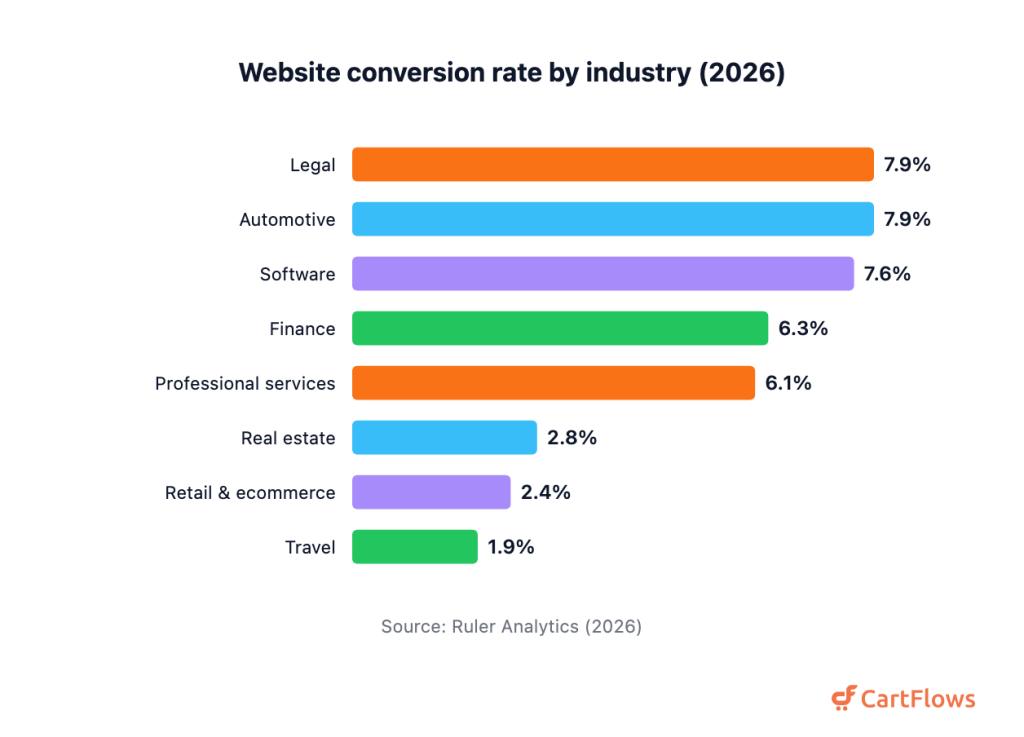
In 2026, legal and automotive sites topped the conversion table at 7.9%, while travel sat at the bottom near 1.9%.[1] Your “good” rate depends heavily on what you sell. So compare yourself to your industry, not to a global average.
- In 2026, Legal websites converted at 7.9%, tied for the highest of any industry.[1]
- Automotive matched it at 7.9%.[1]
- Software converted at 7.6%.[1]
- Finance and Education both sat at 6.3%.[1]
- Marketing and advertising sites converted at 6.2%.[1]
- Professional services converted at 6.1%.[1]
- Construction and engineering converted at 4.9%.[1]
- Real estate converted at 2.8%.[1]
- Retail and ecommerce converted at 2.4%.[1]
- Health and social care converted at 2.3%.[1]
- Travel converted lowest at 1.9%.[1]
- On landing pages specifically, entertainment led with a median of 12.3%, while SaaS pages ran at 3.8%.[14]
- Measured visitor-to-lead, legal services again led at 7.4% and B2B SaaS trailed at 1.1%.[15]
Website conversion rate by industry (2026)
The spread is the story. A 2.4% rate would be poor for a law firm and excellent for a retailer. If you sell across sectors, our ecommerce conversion rate statistics page digs deeper into the retail side.
Conversion Rates by Channel
In 2026, AI referral traffic converted highest at 5.8%, edging out paid search, while paid social brought up the rear near 2.11%.[1] Where a visitor comes from shapes how likely they are to act. It’s one of the biggest levers you’ve got.
- In 2026, AI referral traffic converted at 5.8%, the highest of any channel.[1]
- Paid search converted at 5.4%.[1]
- Email and organic search each converted at 4.9%.[1]
- Referral traffic converted at 4.8%.[1]
- Direct traffic converted at 4.7%.[1]
- Organic social converted at 2.23%.[1]
- Paid social converted lowest at 2.11%.[1]
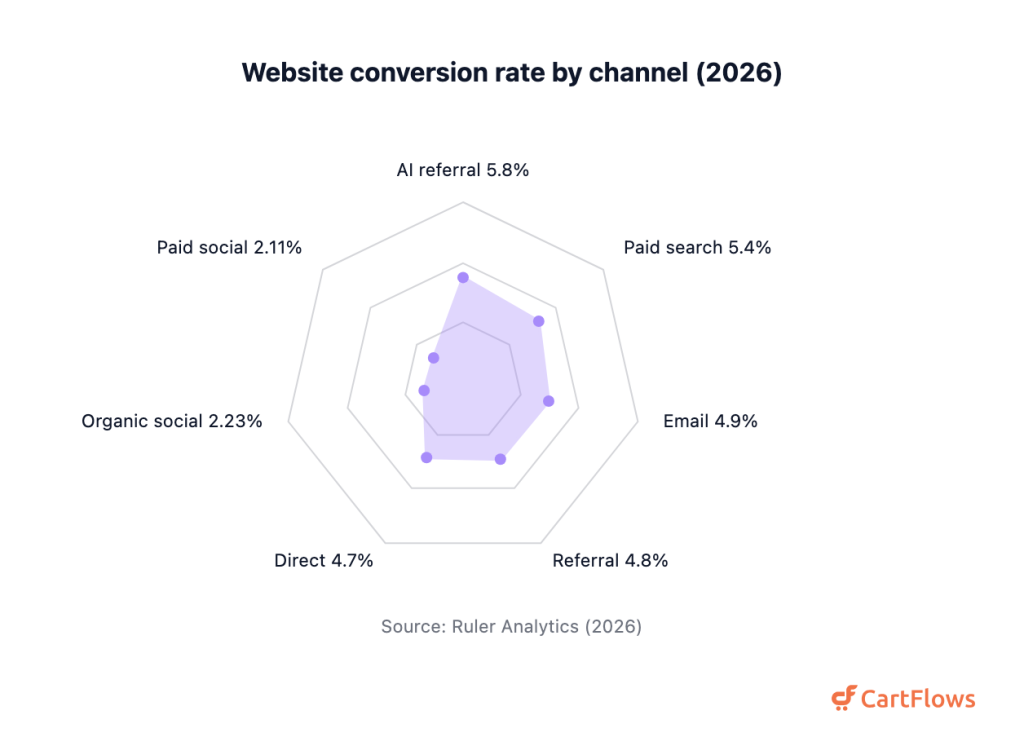
Website conversion rate by channel (2026)
Notice the newcomer. AI referral, meaning visits from tools like ChatGPT and Perplexity, is now the top-converting channel in this dataset. It’s small in volume, but those visitors arrive with intent.
Funnel Stage Conversion Rates
In 2026, a B2B SaaS funnel converts about 39% of leads into marketing qualified leads, then 38% of those into sales qualified leads, and ultimately closes 37% of its sales qualified leads.[16] Every stage leaks. Knowing where yours leaks most is how you fix it.
- B2B SaaS funnels convert 39% of leads to MQLs, 38% MQL to SQL, 42% SQL to opportunity, and 37% to closed.[16]
- eCommerce funnels convert 23% of leads to MQLs, then 58%, 66%, and 60% through the later stages.[16]
- Legal services convert 32% of leads to MQLs, then 35%, 48%, and 46%.[16]
- Financial services convert 29% of leads to MQLs, then 38%, 49%, and 53%.[16]
- Higher education posts the strongest top of funnel, converting 45% of leads to MQLs, then 46%, 61%, and 66%.[16]
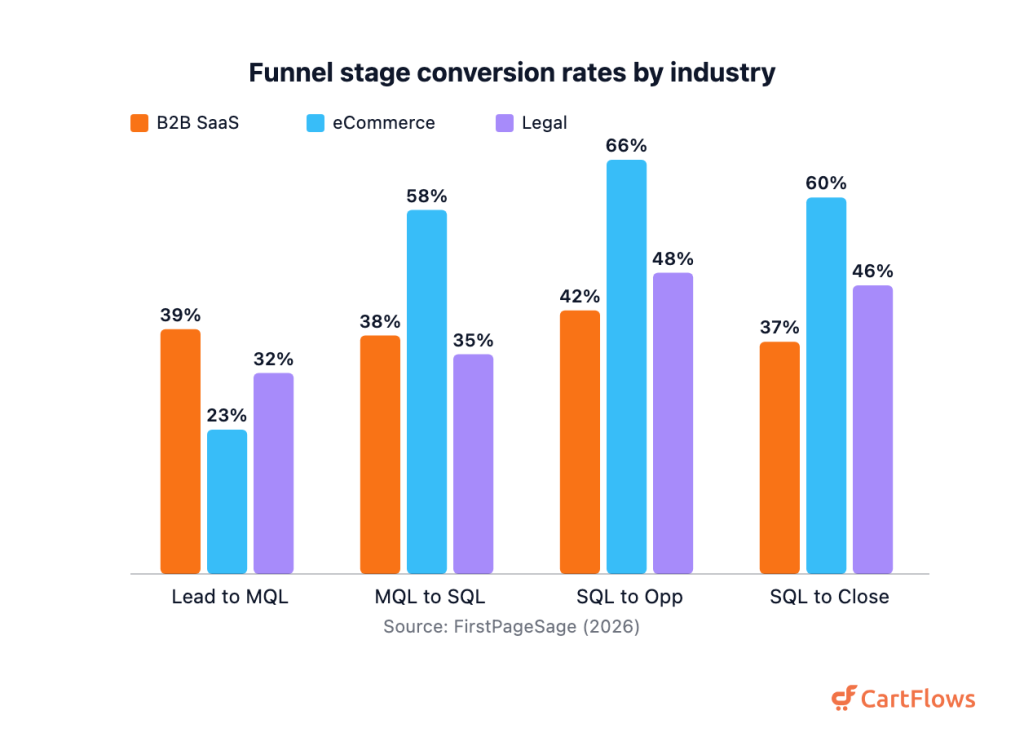
Funnel stage conversion rates by industry
A few extremes stand out across the full dataset:[16]
- Pharmaceutical closes the highest share of qualified leads, at 64%.[16]
- HVAC has the strongest top of funnel among trades, converting 42% of leads to MQLs.[16]
- Aerospace and aviation start narrow at 18% lead to MQL but close 61% of qualified leads.[16]
Here’s the full stage-by-stage picture across 30 industries:[16]
| Industry | Lead to MQL | MQL to SQL | SQL to Opp | SQL to Close |
|---|---|---|---|---|
| Addiction Treatment | 23% | 39% | 45% | 48% |
| Aerospace & Aviation | 18% | 32% | 49% | 61% |
| Automotive | 21% | 42% | 46% | 49% |
| B2B SaaS | 39% | 38% | 42% | 37% |
| Biotech | 36% | 40% | 48% | 55% |
| Business Insurance | 23% | 51% | 49% | 52% |
| Construction | 17% | 37% | 50% | 54% |
| Cybersecurity | 24% | 40% | 43% | 46% |
| eCommerce | 23% | 58% | 66% | 60% |
| Engineering | 27% | 36% | 48% | 52% |
| Entertainment | 19% | 41% | 54% | 61% |
| Environmental Services | 20% | 43% | 58% | 54% |
| Financial Services | 29% | 38% | 49% | 53% |
| Fintech | 21% | 46% | 49% | 58% |
| Healthcare | 24% | 38% | 51% | 51% |
| Heavy Equipment | 29% | 48% | 58% | 56% |
| Higher Education | 45% | 46% | 61% | 66% |
| Hotels & Resorts | 21% | 47% | 58% | 60% |
| HVAC | 42% | 51% | 55% | 49% |
| Industrial IoT | 22% | 39% | 46% | 51% |
| IT & Managed Services | 19% | 38% | 41% | 46% |
| Legal Services | 32% | 35% | 48% | 46% |
| Manufacturing | 26% | 41% | 46% | 51% |
| Oil & Gas | 32% | 38% | 42% | 47% |
| Pharmaceutical | 41% | 56% | 51% | 64% |
| Real Estate | 27% | 33% | 40% | 53% |
| Software Development | 28% | 39% | 60% | 59% |
| Solar | 45% | 36% | 58% | 61% |
| Staffing & Recruiting | 25% | 32% | 45% | 52% |
| Transportation & Logistics | 31% | 44% | 49% | 56% |
Read across, not down. eCommerce starts narrow at the top but closes strong once someone is qualified, which is exactly what a good WordPress sales funnel is built to do.
Top of Funnel: Awareness and Research
In 2026, 67% of B2B buyers said they’d rather buy without talking to a sales rep at all.[3] The top of the funnel now runs on content and trust, not cold outreach. So the awareness stage is where a lot of the buying decision quietly happens.
- In 2026, 67% of B2B buyers said they prefer a rep-free buying experience.[3]
- Buyers spend just 17% of the B2B purchase journey meeting with potential suppliers.[17]
- 61% of B2B buyers consume three to seven pieces of content before talking to a salesperson.[18]
- 51% of buyers say the vendor content they see is too generic, up from 38% a year earlier.[18]
- Organic search drives about 53% of all trackable website traffic.[19]
- 89% of consumers say a video’s quality affects how much they trust the brand behind it.[20]
- 84% of consumers want to see more video from brands.[20]
- 96% of people have watched an explainer video to learn about a product or service.[20]
- 88% of consumers trust recommendations from people they know above any other channel.[21]
- 61% of TikTok users say they discover new brands and products on the platform.[22]
- 46% of B2B marketers expect their content marketing budget to grow in 2025.[23]
The takeaway is blunt. If two-thirds of buyers want to self-serve and most of the journey is research, your content is your top sales rep. Treat it that way.
Lead Capture and Landing Pages
The median landing page converts at 6.6%, but small choices swing that number hard, and simple copy is one of the biggest.[2] Reading level, form length, and social proof all move the needle. None of them cost much to fix.
- The median landing page converts at 6.6% across industries.[2]
- Pages written at a 5th to 7th grade reading level convert at 11.1%.[24]
- Pages written at a professional reading level convert at just 5.3%.[24]
- Personalized calls to action convert 202% better than static ones, across 330,000+ CTAs.[9]
- Removing navigation and footer links lifted conversions 16 to 28% on mid-funnel pages.[25]
- Landing page forms with three fields convert highest, at about 25%.[26]
- A product with five reviews is 270% more likely to be purchased than one with none.[8]
- That review lift climbs to 380% for higher-priced items, and 190% for lower-priced ones.[8]
- Purchase probability peaks at ratings between 4.0 and 4.7 stars, not a perfect 5.0.[8]
- The top 10% of popups convert at 57.7%, though the average sits near 4 to 5%.[27]
- A separate benchmark puts the average popup at 11.09%, with the top tier at 42.35%.[28]
- 85% of people say they’ve been convinced to buy something after watching a video.[20]
- 63% of people prefer a short video over any other format to learn about a product.[20]
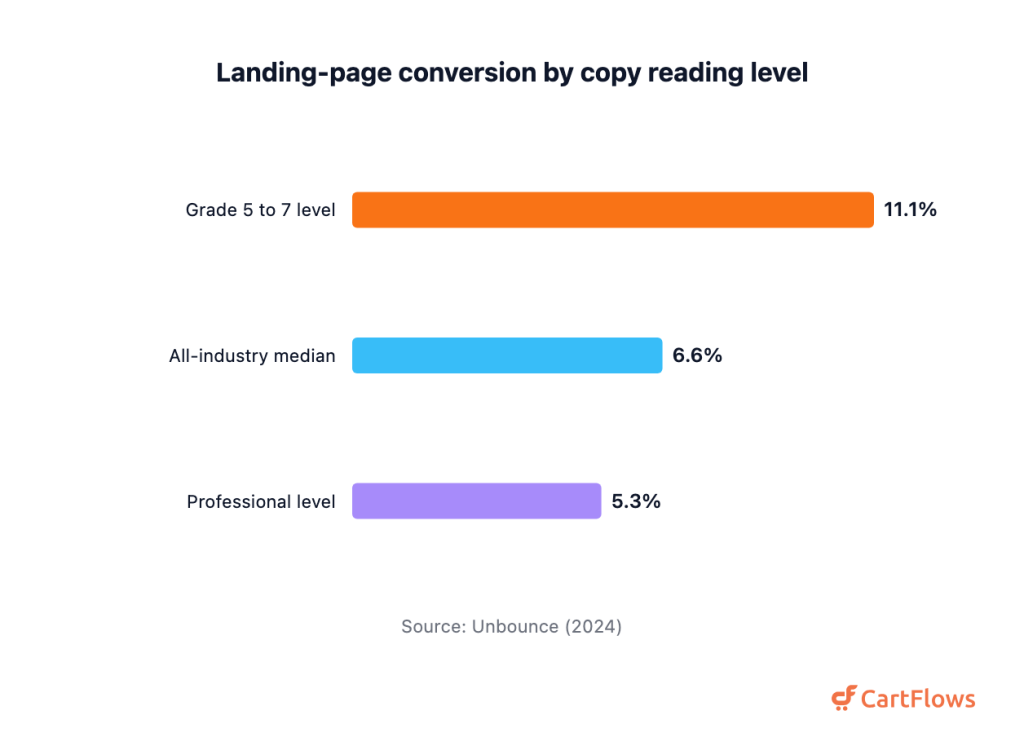
Landing-page conversion by copy reading level
So plain words beat clever ones. Cut your form fields, write like you talk, and put real reviews near the button. If you build on WooCommerce, our lead generation funnels and A/B split testing tools make those tests easy.
Lead Nurturing and Follow-Up Speed
Speed decides more deals than most teams realize: waiting 30 minutes instead of 5 cuts your odds of contacting a lead by 100x.[4] The classic study behind that number is old, but nobody has overturned it. And most teams still respond far too slowly.
- The odds of contacting a lead drop 100x when you wait 30 minutes versus 5.[4]
- The odds of qualifying a lead drop 21x over that same 5-versus-30-minute gap.[4]
- Contact odds fall more than 10x within the first hour of delay.[4]
- Qualifying odds fall more than 6x in that first hour.[4]
- Wednesday and Thursday are the best days to reach a lead, by about 49.7% over the worst day.[4]
- 43% of marketers say their lead nurturing strategy needs improvement, and only 12% call it excellent.[29]
- About 70% of marketers report that leads now arrive later in the journey because buyers self-research first.[10]
- Nurtured leads make purchases about 47% larger than non-nurtured ones.[30]
- Companies that nurture leads see roughly 20% more sales opportunities.[30]
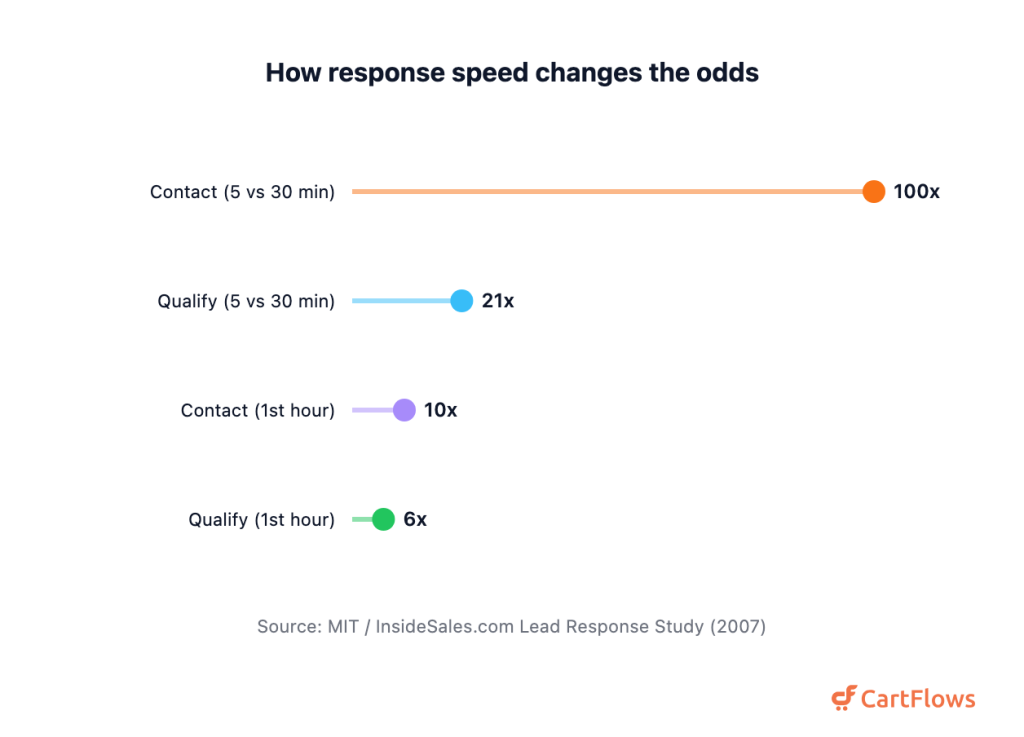
How response speed changes the odds
The lesson hasn’t changed in years. Call fast, follow up on a schedule, and don’t let good leads go cold while you polish a pitch.
Middle of Funnel: Lead Qualification
In 2026, MQL to SQL conversion runs from a low near 10% in legal and real estate to a high of 26% in business insurance and HVAC.[31] The middle is where you separate curiosity from real intent. It’s also where a lot of pipeline quietly dies.
- Business insurance and HVAC post the highest MQL to SQL rates at 26%.[31]
- eCommerce and heavy equipment convert MQLs to SQLs at 23%.[31]
- Higher education converts MQLs to SQLs at 21%.[31]
- Legal services and real estate post the lowest, near 10%.[31]
- 40% of marketers name lead quality their single most important success metric.[10]
- 30% of marketers say generating leads is a top challenge.[10]
- 47% of marketers use automation to improve efficiency, much of it in qualification.[10]
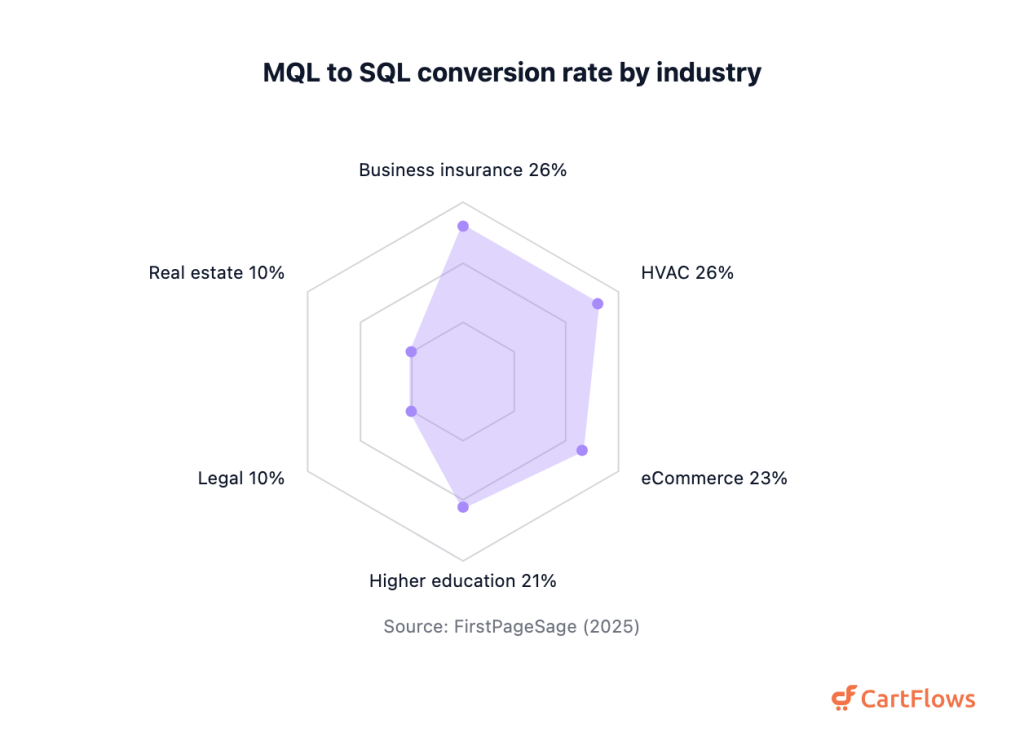
MQL to SQL conversion rate by industry
Qualification is a filter, not a formality. When lead quality is the metric marketers care about most, the funnel’s middle deserves as much attention as its top.
Closing: Win and Conversion Rates
The average sales team closes about 20% of the deals it works, and even software, the strongest category, sits near 22%.[5] One in five is the rough baseline. Trials and demos are where you can beat it.
- The average sales close rate across industries is about 20%.[5]
- Software closes highest at about 22%.[5]
- Finance closes at about 19%.[5]
- Biotech closes lowest among these at about 15%.[5]
- The average B2B sales win rate is around 21%.[32]
- Opt-out free trials that require a card convert to paid at about 48%.[33]
- Opt-in free trials with no card convert at about 18%.[33]
- About 70.22% of online shopping carts are abandoned before purchase, averaged across 49 studies.[34]
- Unexpected extra costs are the top reason for checkout abandonment, cited by 48% of shoppers.[34]
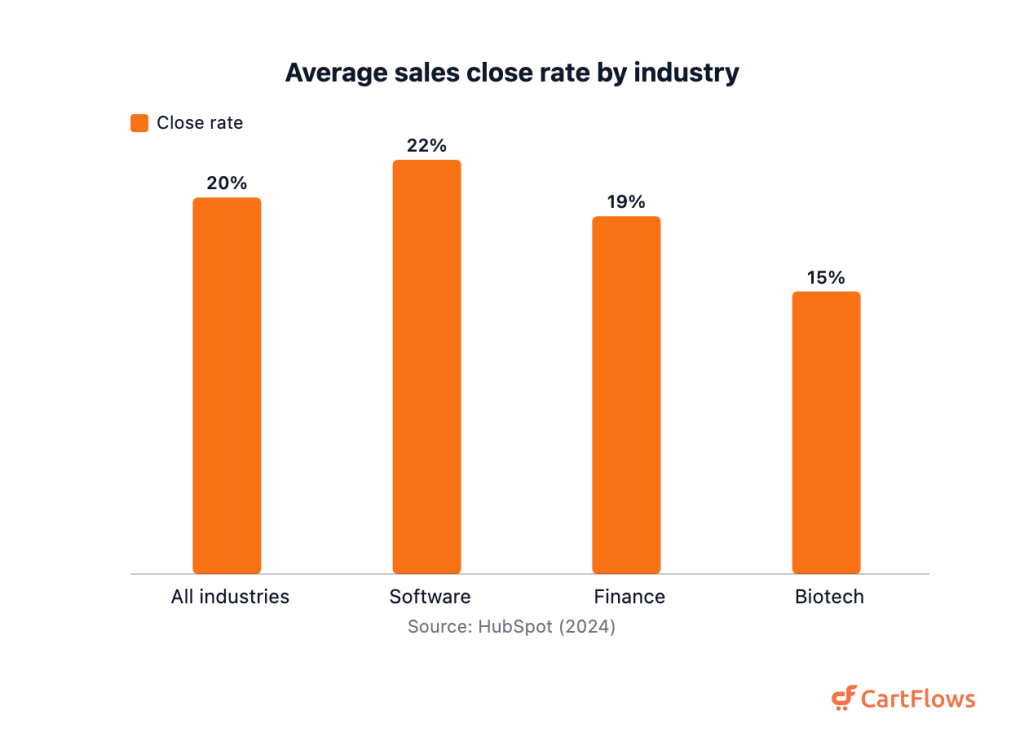
Average sales close rate by industry
Closing is where funnel design pays off most. Order bumps, one-click upsells, and a clean checkout all lift the final number, which is why we built one-click order bumps and cart abandonment recovery into the platform. For the ecommerce side, see our [cart and checkout abandonment statistics](/cart-checkout-abandonment-statistics/).
Customer Acquisition Cost by Industry
What you pay to win a customer shapes the whole funnel, and in 2026 it ranges from under $90 in ecommerce to well over $1,000 in education and fintech.[35] CAC is only half the equation. Pair it with lifetime value and you’ll know whether the funnel actually pays.
- In 2026, B2B SaaS had a combined average customer acquisition cost of $239.[35]
- B2B ecommerce had the lowest CAC of any sector, at about $86.[35]
- Legal services paid $749 to acquire a customer.[35]
- Financial services paid $784.[35]
- Manufacturing paid $723.[35]
- HVAC services kept CAC low at $296.[35]
- Education carried the highest CAC in the B2B set, at $1,143.[35]
- Among SaaS verticals, fintech was the most expensive to acquire, at $1,450.[35]
- In B2C ecommerce, organic channels cut CAC to about $64, versus $68 for paid.[36]
- Most companies should aim for a lifetime-value to CAC ratio of at least 3 to 1.[35]
Notice how organic channels pull CAC down. That’s the quiet case for owning your funnel and traffic instead of renting them, which is where a WordPress sales funnel earns its keep.
Sales Funnel Tools and Automation
The funnel tooling market splits into two camps, and they aren’t measured the same way. On one side are WordPress plugins that add funnels to a site you already own. On the other are hosted SaaS platforms. We’ll keep the two separate so the numbers stay honest, because an install count and a crawler’s live-site count aren’t the same thing.
Start with WordPress, where active-install counts come straight from the plugin directory:[7]
- CartFlows is active on 200,000+ WordPress sites, the most of any WordPress funnel plugin.[7]
- CartFlows holds a 4.8 out of 5 rating across 499 reviews on the plugin directory.[7]
- FunnelKit, the next-largest WooCommerce funnel plugin, is active on 30,000+ sites.[37]
- WPFunnels is active on 5,000+ sites.[38]
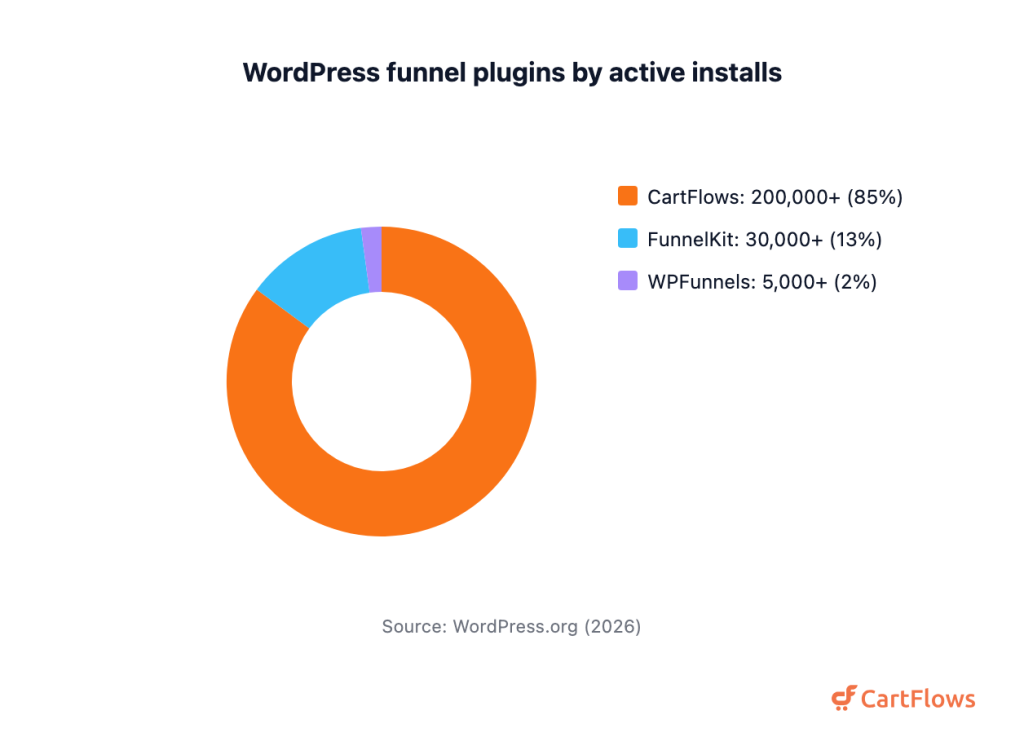
Share of active installs among the WordPress funnel plugins shown.
The hosted platforms play a different game, so we count them their own way, by live sites a crawler can detect:[6]
- 143,664 live sites run ClickFunnels.[6]
- ClickFunnels has been used on 493,591 sites over time.[6]
- 51,717 live sites run Kajabi.[39]
- 12,240 live sites run Kartra.[40]
- Kajabi has been used on 133,238 sites over time.[39]
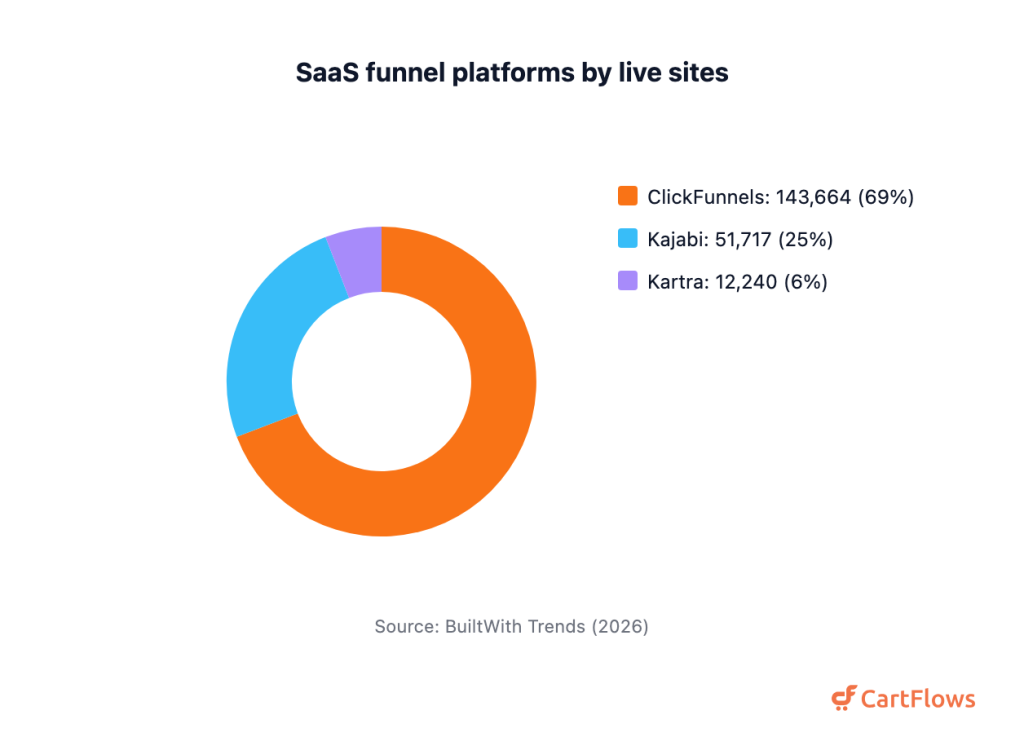
Share of live sites among the SaaS funnel platforms shown.
Automation pays off across both camps:
- Marketing automation returns about $5.44 for every dollar spent.[41]
- Companies adopting automation lifted lead generation by about 225%.[41]
One clarification so the CartFlows numbers don’t confuse. Its 200,000+ figure is the active install base on WordPress.org, whereas a crawler like BuiltWith fingerprints CartFlows on only 13,490 live pages.[42] Both are accurate. They just count different things, which is exactly why we didn’t drop CartFlows into the SaaS chart above.
You don’t need ten tools to compete. If you run WordPress, a single funnel builder for WordPress and WooCommerce covers checkout, upsells, and testing, and our sales funnel builder comparison walks through the options. For how fast the underlying platform is growing, our WooCommerce statistics roundup has the numbers.
Post-Purchase: Retention and Lifetime Value
The funnel doesn’t end at the sale, and the math after it is brutal: winning a new customer can cost 5 to 25 times more than keeping one you already have.[11] Retention is cheaper than acquisition, every time. It’s also where most of the profit hides.
- Acquiring a new customer can cost 5 to 25x more than retaining an existing one.[11]
- Raising customer retention by 5% can lift profits by 25 to 95%.[43]
- The odds of selling to an existing customer are 60 to 70%, versus 5 to 20% for a new prospect.[44]
- Repeat customers spend about 67% more than new ones.[45]
- Roughly 35% of Amazon’s revenue is generated by its recommendation engine.[46]
- 88% of consumers trust recommendations from people they know, which powers referrals.[21]
A sale is the start of the next funnel. Post-purchase upsells and a reason to come back are how you turn one order into a customer, so we bake one-click upsells into the buying flow.
Sources and Methodology
This page compiles sales funnel statistics from primary sources: the organizations that actually produced the data. That includes Ruler Analytics, Unbounce, FirstPageSage, HubSpot, Gartner, Wyzowl, the Spiegel Research Center at Northwestern, Nielsen, Baymard Institute, BuiltWith, IRP Commerce, and the MIT / InsideSales.com Lead Response Management Study.
We chased each figure to its origin rather than quoting another roundup. Where a widely-shared number couldn’t be traced to a real study, we dropped it. That’s why you won’t see the popular “documented funnels earn 2.3x more ROI” claim, or the “80% of sales need five follow-ups” line: neither traces to a verifiable primary source. A few load-bearing figures are older classics (the retention economics from Bain, Harvard Business Review, and Marketing Metrics, plus the 2007 response-time study), and we’ve dated those honestly in the text rather than dressing them up as new.
Numbers reflect the latest data available as of July 2026. Conversion benchmarks vary by how they’re measured, so we note whether a rate is per landing page, per session, or site-wide.
Final Thoughts
The numbers point one direction. Funnels win on the basics done well: fast follow-up, plain copy, honest social proof, and a checkout that doesn’t fight the buyer. Most of the pages that rank for this topic repeat figures nobody can trace, and that’s the real gap we set out to close. Treat these benchmarks as a mirror, not a target. Find the stage where yours leaks most, fix that one thing, and measure again. That’s how good funnels get built, one honest number at a time.
Frequently Asked Questions
References
2. Unbounce
3. Gartner
5. HubSpot
6. BuiltWith
9. HubSpot
10. HubSpot
12. IRP Commerce
13. WordStream
14. Unbounce
15. FirstPageSage
16. FirstPageSage
17. Gartner
19. BrightEdge
20. Wyzowl
21. Nielsen
22. TikTok
23. Content Marketing Institute
24. Unbounce
25. HubSpot
26. HubSpot
27. Wisepops
28. OptiMonk
30. Annuitas Group
31. FirstPageSage
32. HubSpot
33. FirstPageSage
35. FirstPageSage
36. FirstPageSage
37. WordPress.org
38. WordPress.org
39. BuiltWith
40. BuiltWith
41. Nucleus Research
42. BuiltWith
43. Bain & Company
45. BIA / Manta
46. McKinsey