The average US checkout still asks for 11.3 form fields when 8 would do.[1] Across the 344 largest US and EU ecommerce sites, 65% score mediocre or worse on checkout usability.[1] Not one scores perfect. That’s the state of checkout, and this page has 130 of them behind it, each traced to the organization that measured it.
Every figure was read on the page of the organization that produced it. For the abandonment side of the same funnel, our cart and checkout abandonment statistics page covers rates, reasons and recovery. We didn’t take numbers from aggregators.
The big picture on checkout optimization
- 40% of US online shoppers abandoned a checkout because extra costs were too high, the highest-ranking fixable reason.[1]
- The average US and EU checkout flow contained 11.3 form fields in 2024, against the 8 fields most sites actually need.[1]
- 54.4% of shoppers who started an ecommerce purchase form finished it, measured across 20,179,282 form sessions.[2]
- Surfacing at least one relevant non-card payment method raised conversion 7.4% and revenue 12% against a randomized holdback.[3]
- Every 100 milliseconds of extra Largest Contentful Paint came with roughly 3.5% lower conversion across actively selling stores in early 2026.[4]
- 62% of benchmarked sites fail to make guest checkout the most prominent option at the account step.[1]
- Smartphones carried 56.4% of US online holiday sales value in 2025, up from 54.5% a year earlier.[5]
- Digital wallets took 40% of US ecommerce transaction value in 2025 against 56% globally, a 16 point gap that most pages flatten.[6]
- Only 33% of detected WooCommerce stores passed all three Core Web Vitals on desktop in 2025, against 76% of Shopify stores.[7]
- The famous 35.26% checkout uplift is a modelled ceiling, not a measured result, applied to a $738 billion US and EU sales base to produce the $260 billion figure.[1]
- The big picture on checkout optimization
- Checkout optimization benchmarks
- Form fields and input friction
- Guest checkout versus forced account creation
- Checkout length and flow design
- Page speed and performance at checkout
- Mobile checkout
- Payment methods and digital wallets
- Buy now, pay later at checkout
- Trust, security and fraud friction
- Cost transparency: shipping, taxes and fees
- What checkout optimization is actually worth
- Checkout statistics that don't hold up
- Sources and methodology
- Final Thoughts
- Frequently Asked Questions
- References
Checkout optimization benchmarks
Among shoppers who began an ecommerce purchase form, 54.4% completed it in 2025, measured across 20,179,282 form sessions.[2] On Shopify stores sampled in 2023, 45% of checkout sessions ended in an order. The best-performing 10% of stores cleared 66%.[8] That’s a 21 point spread. Checkout is a lever, not a constant.
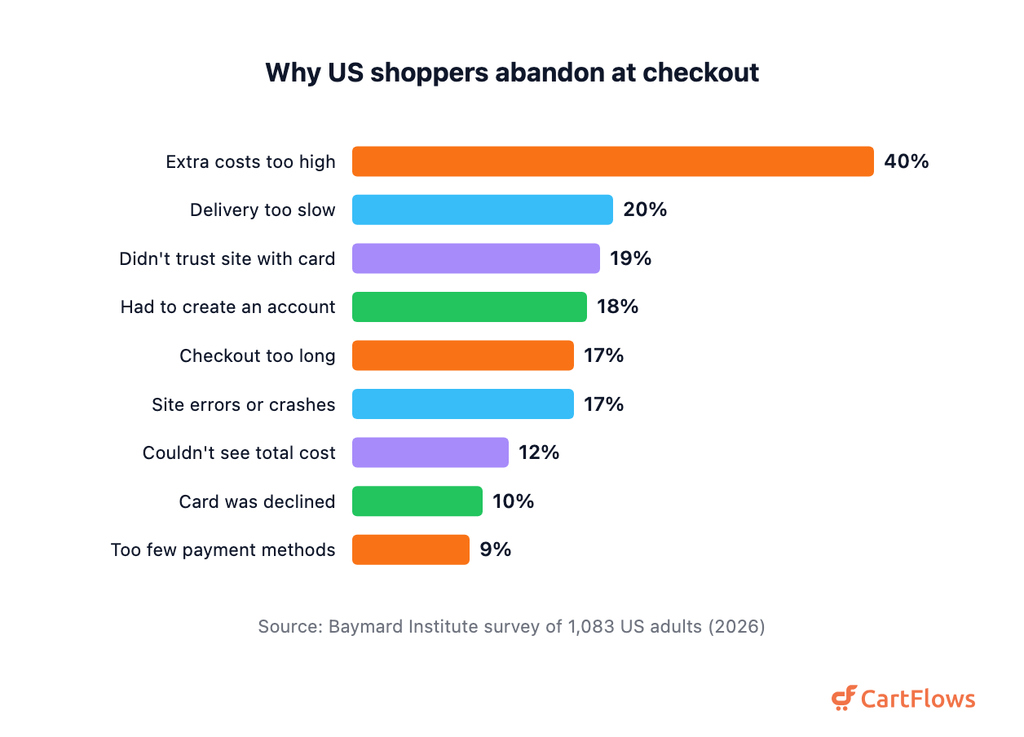
Why US shoppers abandon at checkout
- Technical failure costs as much as friction. 17% of US shoppers abandoned because the website had errors or crashed, level with the share who blamed a long checkout.[1]
- Desktop purchase forms converted at 56.9% against 51.4% on mobile, with tablets at 56.4%.[2]
- Measured from form view rather than form start, ecommerce checkout completion drops to 35.36%, with mobile at 30.99%.[2]
- 45% was the average Shopify checkout completion rate in Littledata’s 2023 sample, with the top 20% of stores above 59%.[8]
- Split by device in that same 2023 sample, mobile checkout completion ran 44% against 49% on desktop.[8]
- The average checkout flow ran 5.1 steps long in 2024, a length that has barely moved since tracking began in 2012.[1]
- Of 344 benchmarked US and EU sites, 65% scored mediocre or worse on checkout usability, 33% scored decent and only 2% scored good.[1]
- The average benchmarked site still had 32 distinct checkout usability improvements available to it.[1]
- 6.08% of product page views ended in an item being added to the cart. The denominator there is items, not sessions.[9]
- Shoppers took 3 minutes 21 seconds on average to complete a checkout form, the slowest broad form category tracked.[2]
- People who quit a checkout form did so after a median of 1 minute 5 seconds.[2]
- Site-level conversion fell 5.1% year over year in Q4 2025 across 99 billion sessions. That’s a change, not a level.[10]
One caution on that list. Form session rates and cart abandonment rates have different denominators, so they aren’t interchangeable.
Form fields and input friction
Password fields were abandoned more often than any other input in 2025, at 10.5%.[2] Address fields took the longest to fill, at 7.4 seconds on average.[2] That’s field-level telemetry. It points at which fields you ask for, not just how many.
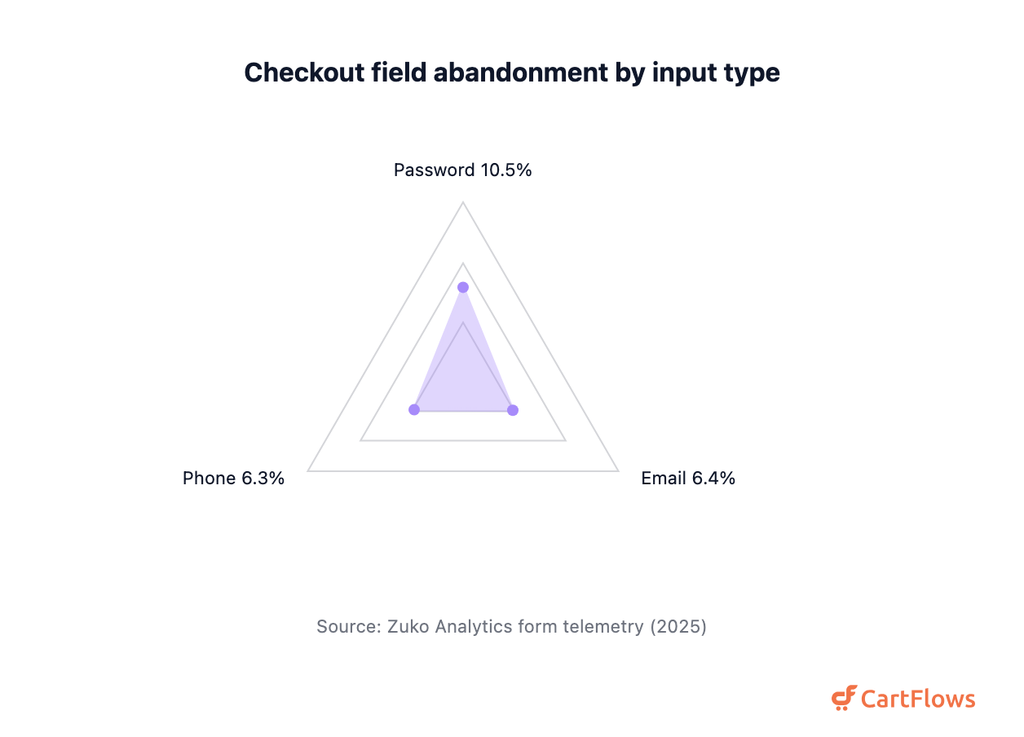
Password fields are abandoned more often than any other checkout input type.
The benchmark counterpart to that telemetry is field count. Checkout flows on 344 benchmarked sites carried an average of 11.3 form fields in 2024. That’s down from 11.8 in 2021 and 12.7 in 2019, against an optimum of 8.[1]
Count form elements instead, which adds checkboxes, drop-downs and radio buttons. Then it’s 19.9 against 12 in an optimized flow.[1] Two different units. They don’t belong in the same comparison.
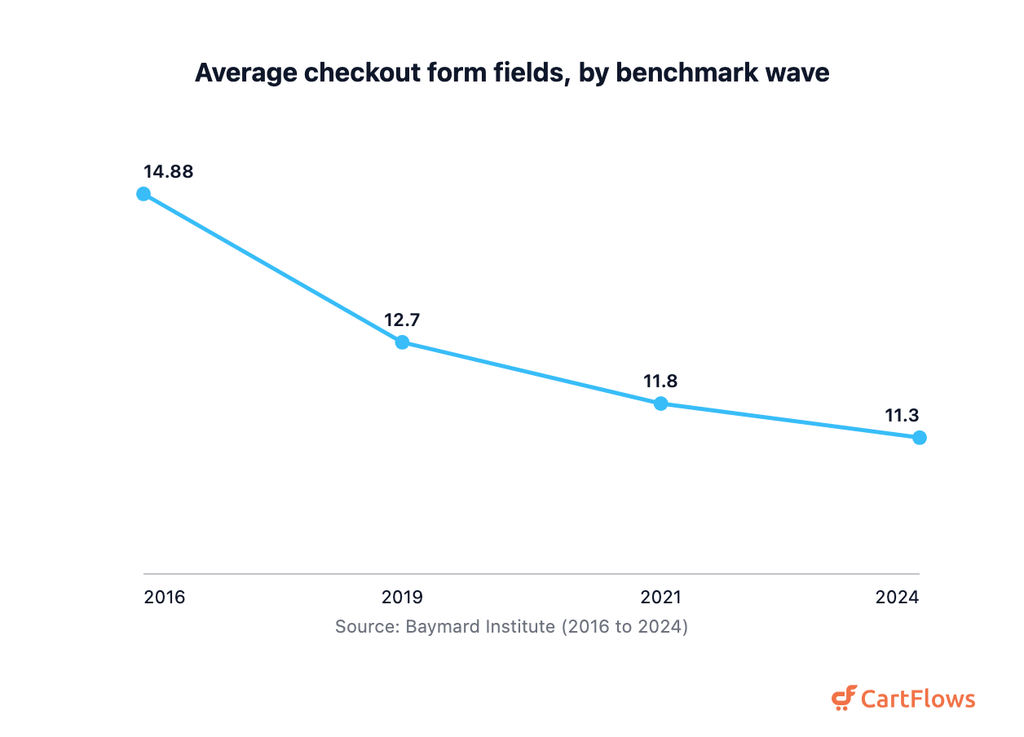
Average checkout form fields, by benchmark wave. Baymard puts the optimum at 8 fields.
- Password fields carry the highest field abandonment rate of any input type at 10.5%.[2]
- Email fields were abandoned at 6.4% and phone fields at 6.3%, independently echoing the survey finding on phone numbers.[2]
- The address field takes the longest to complete of any field type, at 7.4 seconds on average.[2]
- Chrome telemetry shows browser autofill users abandoning forms 75% less often and filling them about 35% faster. Google explicitly warns that this is correlational, not causal.[11]
- The 2016 benchmark wave recorded 23.48 form elements and 14.88 form fields in the average US checkout. That’s where the still-circulating “14.88 fields” number comes from.[1]
- Name entry is split across two or more inputs on 89% of benchmarked sites.[1]
- In moderated testing, 42% of participants typed their full name into a field labelled “First Name”.[1]
- Given a single “Full Name” field instead, only 4% of participants hesitated.[1]
- Reaching “Address Line 2” brought 30% of test participants to a complete stop.[1]
- Three quarters of benchmarked sites, 75%, still show “Address Line 2” rather than hiding it behind a link.[1]
- A coupon field appears in 70% of benchmarked checkouts, and 35% display it expanded by default.[1]
- 55% of benchmarked sites offer no fully automatic address lookup at all.[1]
- Typos or misspellings appear in 9% of manually entered shipping addresses.[1]
- Even where lookup exists, 69% of test participants ignored the autocomplete suggestion. They typed city, state and ZIP by hand.[1]
- Inline form validation is missing entirely from 31% of benchmarked ecommerce sites, and a further 4% implement it incorrectly.[1]
- 94% of sites fail to use adaptive error messages matched to the specific validation problem.[1]
- 61% of benchmarked sites don’t mark both required and optional fields explicitly.[1]
- Nearly half of sites, 49%, require a phone number without explaining why.[1]
- Regressing field count against completion across its benchmarking base, one form analytics provider found field count had no effect on conversion rate.[2]
The 8-field target and that last bullet genuinely conflict. We’re not going to smooth it over. One says cut to 8 fields. The other says field count doesn’t move the completion rate at all. Usability testing measures friction in a lab. Live telemetry measures what finished.
If you’re cutting fields on a WooCommerce store, our guides to checkout field control and customizing the WooCommerce checkout cover the mechanics.
Guest checkout versus forced account creation
Across 6,750 consumers in nine countries surveyed in 2025, 23% said they always or often abandon a purchase over signup or login problems.[12] Another 40% said sometimes. Long signup and login forms were the top frustration, named by 62%.[12] Identity is where checkout leaks, and it’s rarely instrumented.
Benchmark audits agree. Forced registration was named as an abandonment reason by 18% of US online shoppers, ranking fourth.[1] The problem is prominence, not availability. Most sites offer guest checkout, they just don’t lead with it. But 62% of audited sites fail to make it the most prominent option.[1]
- Across 6,750 consumers in nine countries, 23% said they always or often abandon a purchase over signup or login problems. Another 40% said sometimes.[12]
- 62% of those consumers named long signup or login forms as their top identity frustration, ahead of sensitive information requests at 52%.[12]
- Shopify reports a vendor-measured 18% higher conversion rate for returning customers using Shop Pay.[4]
- Stripe reports a vendor-measured 14% average returning-user conversion increase after enabling Link, with no methodology published.[3]
- Measured differently in 2022, 24% of US shoppers abandoned at least one cart in a quarter solely because an account was required.[1]
- 44% of benchmarked sites make guest checkout needlessly hard to locate, across 1,089 account-step design examples.[1]
- Over half of sites, 54%, don’t wait until the confirmation step to offer account creation.[1]
- No compelling reason to create an account is offered at all by 57% of benchmarked sites.[1]
- On some tested sites in 2022, as much as 19% of checkout abandonment among existing account holders traced to password reset problems.[1]
- 65% of benchmarked sites still impose unnecessarily complex password requirements.[1]
Worth saying plainly: no reliable figure exists for the share of stores that offer guest checkout at all. Benchmarks measure how prominent it is, not whether it’s there. Every “only X% offer guest checkout” claim we chased traced back to a misread stat.
Checkout length and flow design
Checkout length has been stuck at 5.1 steps since tracking began in 2012.[1] It’s the field count, not the step count, that carries the friction. Grading the flows themselves, 64% of desktop sites and 63% of mobile sites scored mediocre or worse in 2025. Mobile apps did better at 46%.[1]
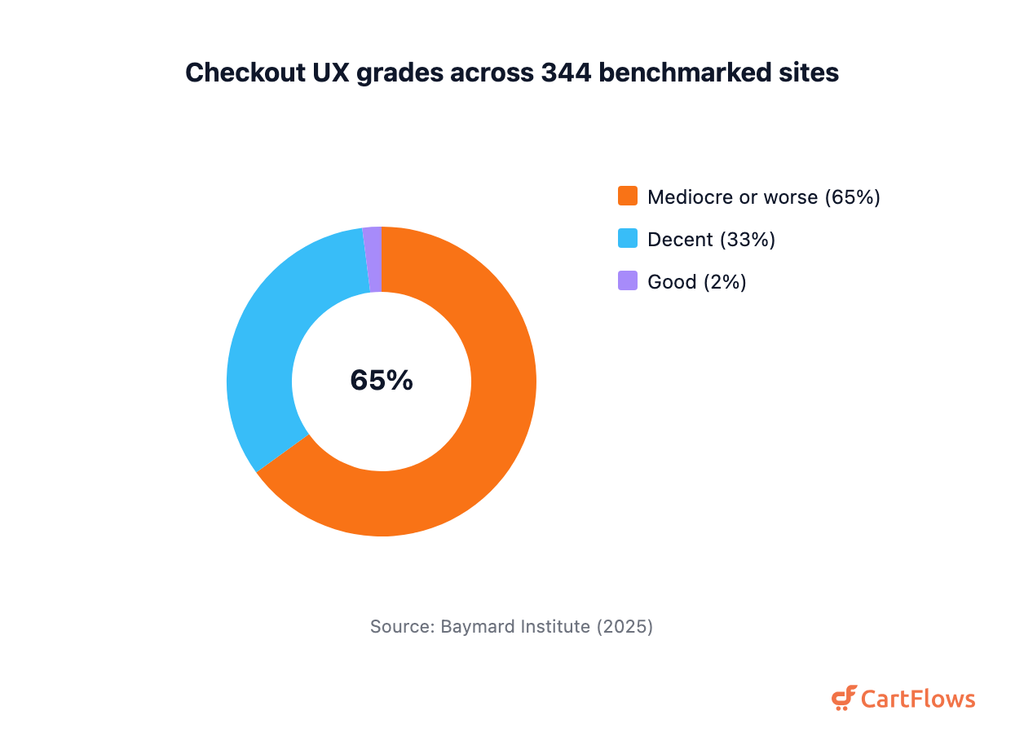
Checkout UX grades across 344 benchmarked sites
- Ultra-long checkouts of 8 or 9 steps are nearing extinction. Genuine 1 or 2 step flows remain almost as rare.[1]
- Only 2% of desktop and mobile sites earned a “good” checkout UX score, and none reached perfect.[1]
- At the bottom of the distribution, 15% of desktop sites rated poor or very poor on checkout UX.[1]
- Cart quantity changes still need a typed edit rather than a button on 97% of benchmarked sites.[1]
- A complicated or overlong checkout was named as an abandonment reason by 17% of US online shoppers.[1]
- The grading itself rests on 41,000+ manually scored checkout elements across 344 sites and 110+ guidelines.[1]
- Across 6.5 million checkout journeys, checkout conversion ran 52.9% with no alternative payment methods. It ran 58.9% with one and 61.9% with two, on a native one-page checkout.[13]
- Two named merchants reported conversion gains of 3.5% and 7% after moving to one-page checkout. No test design was disclosed.[4]
Treat that 9 point payment method spread as an upper bound. It’s an observational cohort comparison, not a randomized test. Merchants who turn on extra payment methods differ in other ways too.
The same caution applies to the two one-page case studies. So we’d point you at how one-page checkout actually works in WooCommerce and at checkout layout options. Not at a headline number.
Page speed and performance at checkout
Conversion fell roughly 3.5% for every additional 100 milliseconds of Largest Contentful Paint. That’s across actively selling stores measured in January and February 2026.[4] Stores at a 2.5 second LCP converted about 30% lower than stores at 1.5 seconds. The money doesn’t stop at Google’s “good” threshold.[4]
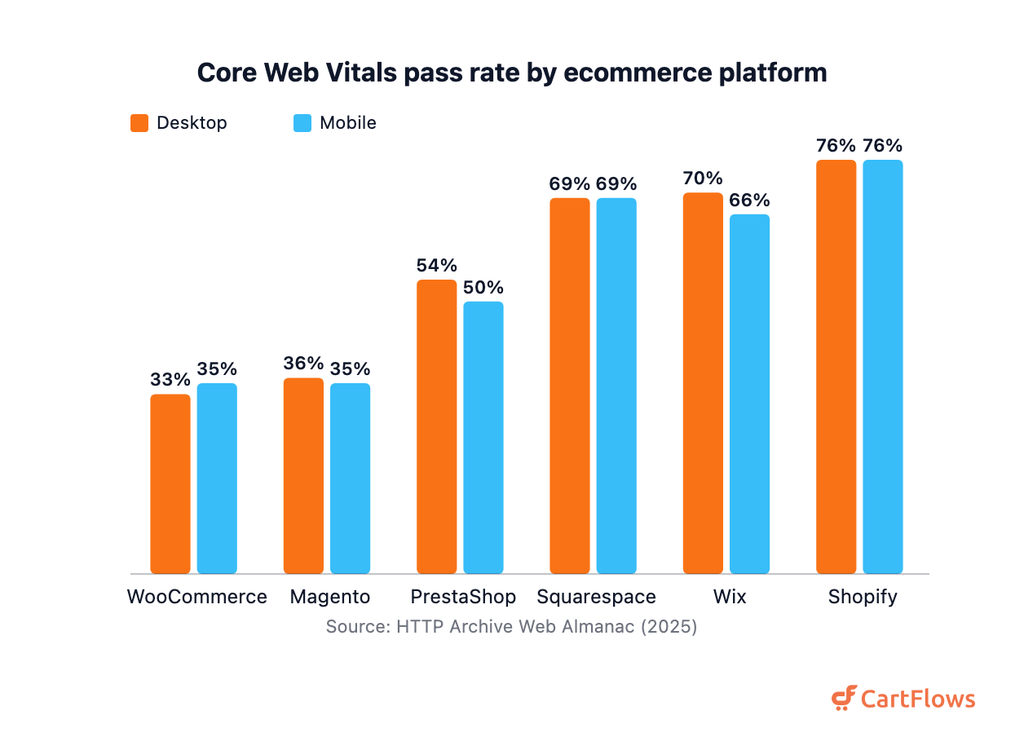
Core Web Vitals pass rate by ecommerce platform
- Interactivity carried a smaller but real cost, at roughly 1.5% lower conversion per 32 milliseconds of slower Interaction to Next Paint.[4]
- Cumulative Layout Shift showed no significant correlation with conversion in that analysis, which contradicts a lot of standard advice.[4]
- Across all web origins in July 2025, 48% passed Core Web Vitals on mobile and 56% on desktop.[7]
- Server response is the binding constraint for most. Only 44% of mobile origins recorded a good Time to First Byte, against 55% on desktop.[7]
- Platform gaps are stark. WooCommerce stores passed Core Web Vitals at 33% on desktop and 35% on mobile, against 76% and 76% for Shopify.[7]
- The middle of that field clusters tightly. Magento passed at 36% on desktop and 35% on mobile, PrestaShop at 54% and 50%, Squarespace at 69% and 69%, and Wix at 70% and 66%.[7]
- Almost all of that gap is paint, not interactivity: 45% of WooCommerce stores hit a good desktop LCP against 92% of Shopify stores.[7]
- Counter to expectation, the top 10,000 ecommerce stores passed Core Web Vitals at 36.0% against 64.7% for the long tail.[14]
- The culprit is script weight. Median mobile INP was 225 milliseconds for the top 10,000 stores, against 100 milliseconds for smaller ones.[14]
- More than 90% of pages load at least one third party, with a median inclusion chain depth of 3.[7]
- API error rates rose 16% year over year across 6,500 monitored sites, attributed to that same third-party growth.[10]
- Stripe reports that tuning how long a device fingerprint script blocks a payment recovered more than $39 million in payments since March 2025. That figure comes from its own multivariate testing.[3]
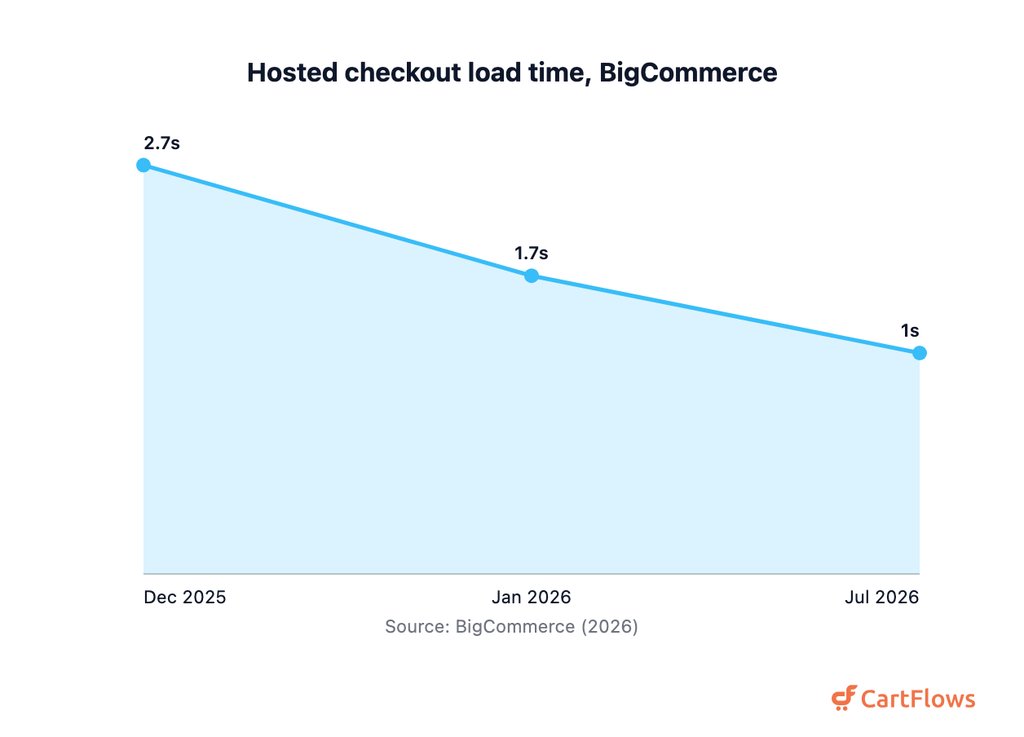
Hosted checkout load time, BigCommerce
- Hosted checkout LCP fell from 2.7 seconds in December 2025 to 1.7 seconds in January 2026 and 1.0 second by July 2026. That’s a 63% improvement in roughly eight months.[15]
- Over the same period the cart to checkout transition became up to 41% quicker, with no conversion figure attached.[15]
That BigCommerce series is, as far as we can tell, the only published checkout-page-specific LCP time series anywhere. Everything else measures homepages or whole origins. That doesn’t tell you much about the page where the money actually moves.
On the WooCommerce side, a faster modern cart is the nearest lever you’ve got.
Mobile checkout
Smartphones carried 56.4% of US online holiday sales value between November and December 2025, up from 54.5% the year before. On Christmas Day it hit 66.5%.[5] Mobile checkout quality hasn’t kept pace. Of benchmarked mobile ecommerce sites, 75% rate only mediocre overall, and exactly one rated good.[1]
- On Thanksgiving Day 2025, mobile took 61.6% of US online sales value, up from 59.3% a year earlier.[5]
- Cyber Monday 2025 saw 57.5% of its $8.2 billion in US online sales placed on mobile.[5]
- Desktop converted 74% higher than mobile across 99 billion sessions. That’s a whole-funnel gap, not a checkout-stage one.[10]
- Mobile carried 69.9% of all web traffic in that same panel. The worst-converting device is also the busiest.[10]
- 63% of benchmarked mobile sites scored mediocre or worse on checkout UX against 46% of mobile apps.[1]
- The 2026 mobile benchmark covers 71,000+ manually reviewed UX elements across 150+ mobile ecommerce sites, and none rated perfect.[1]
- Adaptive validation error messages are absent from 93% of benchmarked mobile sites. That’s the highest failure rate of any mobile form defect.[1]
- 54% of mobile sites are missing an address validator or lookup, on the longest field group in mobile checkout.[1]
The app versus mobile web comparison is worth pausing on. You’ll see “apps convert three to five times better” quoted everywhere. It has no primary behind it. The defensible version is the 46% against 63% UX score gap above.
Payment methods and digital wallets
Digital wallets took 40% of US ecommerce transaction value in 2025, against 56% globally.[6] Mixing those two numbers is the most common error in this category. Cards haven’t been displaced yet. US credit at 32% and debit at 16% of ecommerce value still outrun the 40% wallets take.[6]
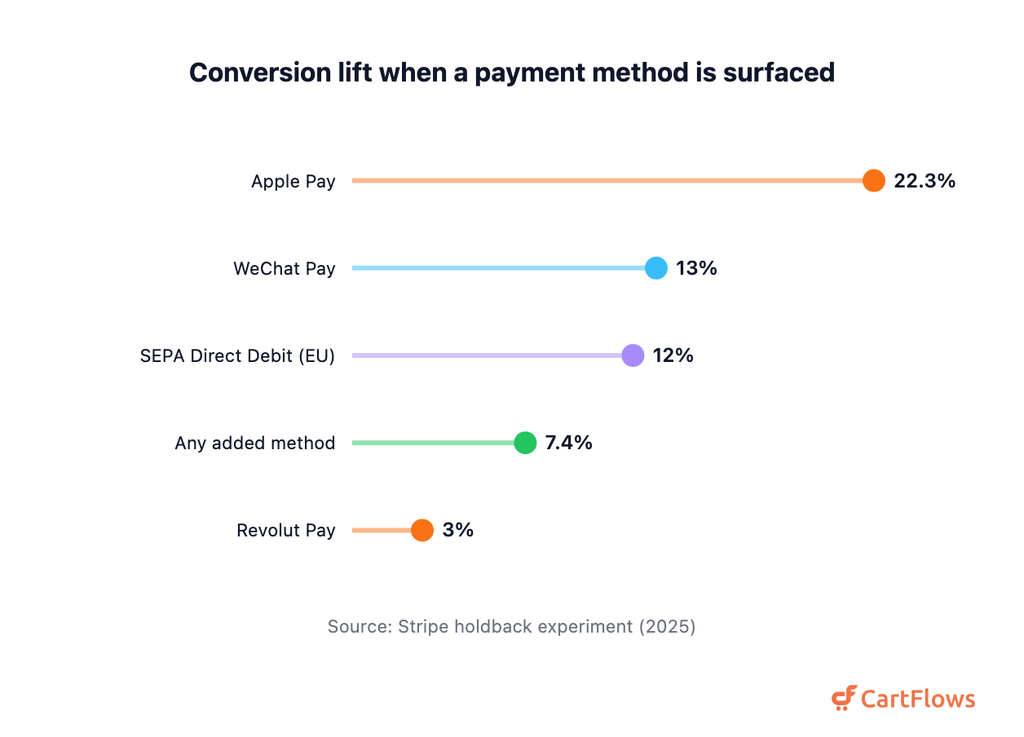
Conversion lift when a payment method is surfaced
- Globally, wallets took 56% of ecommerce transaction value but only 33% of in-person value in 2025.[6]
- Wallet share of US ecommerce value is forecast to reach 44% by 2030.[16]
- Total US wallet spending online and in store is forecast at $4.1 trillion by 2030, up 64% on 2025.[17]
- Asked which method they use most online, 41% of 25 to 34 year olds named a digital wallet against 9% of over-65s. That’s a preference measure, not a value share.[18]
- Against a randomized holdback, surfacing at least one relevant non-card payment method raised conversion 7.4% and revenue 12%.[3]
- Within that same holdback, Apple Pay availability was associated with 22.3% higher conversion and 22.5% higher revenue.[3]
- From a source with no wallet business, 9% of US shoppers named too few payment methods as their reason for abandoning.[1]
- Roughly 56 million US consumers abandoned a cart in a 30 day window because their preferred payment method was missing.[19]
- About 26 million of those abandonments were specifically over a missing digital wallet.[19]
- Generationally, 36% of Gen Z and 31% of millennials abandoned over an unavailable payment method.[19]
- Among 1,278 merchant professionals in 37 countries, 72% used at least one form of payment tokenization and 43% accepted real-time payments.[20]
- Direct crypto payments took 0.19% of global transaction value in 2025 while 10% of merchants accepted them.[6]
The PYMNTS study was sponsored by a wallet and BNPL vendor, so you’d expect the direction of interest. The 10% consumer survey finding comes from a source with no such stake. And the two agree anyway.
Buy now, pay later at checkout
BNPL accounted for 6% of US ecommerce transaction value in 2025. Globally the estimate is $300 billion, up from $2.3 billion in 2014.[6] On the consumer side, 16% of US adults used BNPL in the previous 12 months, up from 15% in 2024 and 10% in 2021.[21] It’s growing, but it isn’t universal.
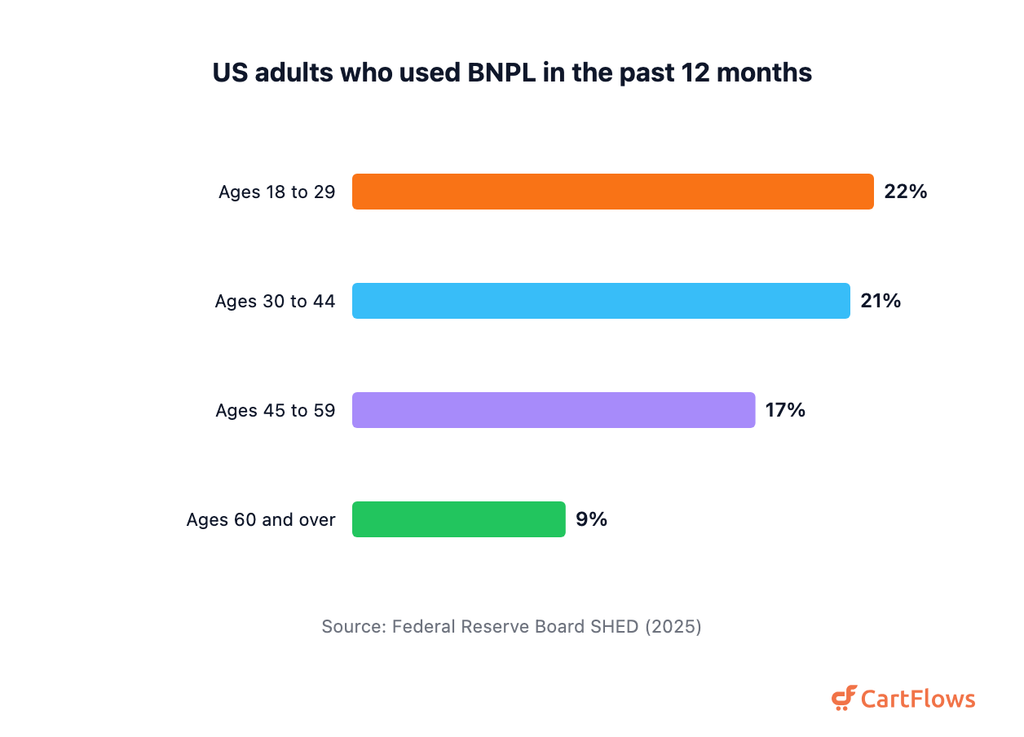
US adults who used BNPL in the past 12 months
- Usage peaks in the lower middle of the income distribution. Adults in $25,000 to $49,999 households used BNPL at 23%, against 12% of those above $100,000.[21]
- By age, 22% of 18 to 29 year olds used BNPL, 21% of 30 to 44 year olds, 17% of 45 to 59 year olds and 9% of those 60 and over.[21]
- Slightly more than one quarter of BNPL users, about 26%, were late on at least one payment.[21]
- Total US BNPL credit issuance reached $156.7 billion in 2025 across the six major providers.[21]
- Classic pay-in-4, the product merchants actually put at checkout, was $78.3 billion of that, exactly half.[21]
- By issuance value, Block and Afterpay held 34%, Affirm 26%, PayPal 17% and Klarna 15%, a ranking that flips inside the pay-in-4 segment alone.[21]
- The average US pay-in-4 loan was $135 in 2023, against $136 in 2019, $138 in 2020, $150 in 2021 and $131 in 2022.[22]
- On 2023 data, 4.1% of pay-in-4 loans were assessed a late fee and 1.83% were charged off, both down year over year.[22]
- For comparison, US commercial bank credit card charge-offs ran 4.19% in Q4 2023, more than double the BNPL rate.[22]
- A narrower extrapolation puts US BNPL purchase value near $70 billion in 2025, about 1.1% of credit card spending.[23]
- US shoppers spent $20 billion through BNPL over the 2025 holiday season, and 82.2% of those purchases happened on a smartphone.[5]
- The only peer-reviewed estimate of BNPL’s commercial effect found purchase probability up 9 percentage points and basket size up 10%, sustained over 26 weeks.[24]
- Estimated average consumer willingness to pay for a standard BNPL bundle is negative. The share with positive willingness closely matches actual take-up.[25]
Read the loan-size series again. Average basket has been flat for six years. That’s hard to square with vendor claims of ever-rising BNPL order values.
Trust, security and fraud friction
Among 881 US online shoppers surveyed in 2025, 18.7% gave up on the purchase entirely after a single failed CAPTCHA.[26] A further 3.9% abandoned the moment a CAPTCHA appeared.[26] Those are two separate behaviours. They shouldn’t be added together into one loss figure.
The strongest finding here is older, and it’s stranger. Distrust of the site with card details was named as an abandonment reason by 19% of US online shoppers, in a 2026 survey of 1,083 people who had shopped online that quarter.[1] Yet in a separate test by the same institute, a homemade and entirely fake security seal outperformed most vendor-issued SSL seals. Only Norton beat it.[1]
It’s recognition that drives perceived security, not validity.
- The lowest-performing seal tested, Comodo, was chosen by just 2.3% of surveyed US adults as most confidence-inspiring.[1]
- An unsatisfactory returns policy was named by 13% of US cart abandoners, and a declined card by 10%.[1]
- Among 881 US online shoppers, 18.7% gave up on the purchase entirely after one failed CAPTCHA attempt.[26]
- A further 3.9% abandoned the cart the moment a CAPTCHA appeared, and the two behaviours shouldn’t be summed into a single abandonment rate.[26]
- 27% of those shoppers reported frustration or distrust when shown a CAPTCHA, rising to 29% among heavy AI tool users.[26]
- Card-testing attacks rose 175% year over year in the first four months of 2026. That’s the upstream reason CAPTCHA keeps appearing at checkout.[27]
- The measured global false-decline rate is 1.51% of ecommerce sales, roughly $151,000 a year on $10 million of revenue.[28]
- Merchants think it’s far worse. Two thirds estimate their false-decline rate at between 2% and 10%, and 38% put it between 2% and 5%.[20]
- Separately, 47% of merchants estimated up to 5% of legitimate orders are wrongly declined. That implies a modelled $50 billion industry loss.[19]
- After one false decline, loyal customers placed 65% fewer orders, spent 16% less per order and 27% never returned.[27]
- Japan’s April 2025 3D Secure mandate cut card payment success by 1.6 percentage points gross and 0.8 points net of retries.[29]
- Frictionless 3D Secure authentication declined or plateaued in 28 of 37 countries in 2025 against the year before.[30]
- 93% of US online shoppers review a retailer’s return policy at least occasionally before buying. The sample was 1,000, fielded in March 2026.[31]
The gap between the measured 1.51% and merchants’ own 2% to 10% guesses is itself the finding here. Merchants overestimate false declines by roughly two to five times. That distorts how much fraud friction they’re willing to add.
Cost transparency: shipping, taxes and fees
Extra costs at checkout were named as an abandonment reason by 40% of US online shoppers in 2026, across a sample of 1,083.[1] Respondents who were only browsing were removed from that base. A different wave, fielded in February 2024 among 1,012 US adults, put the un-normalized figure at 48%.[32] That’s why you’ll see two numbers circulating.
- Slow delivery was the second-ranked reason, named by 20% of US online shoppers.[1]
- A distinct transparency failure shows up separately: 12% abandoned because they couldn’t see or calculate the total order cost up front.[1]
- In 2017 usability testing, 64% of test users looked for shipping cost on the product page before deciding to add to cart.[1]
- That same 2017 audit found 43% of ecommerce sites showing no shipping estimate anywhere on product detail pages.[1]
- Also in 2017, 32% of sites communicated free shipping only through a site-wide banner, and 27% of test users missed it.[1]
- Surveyed in April 2026, 43% of North American consumers said hidden duties and taxes deter them from buying internationally.[33]
- 69% of those consumers said they’d be more likely to complete a purchase if duties were prepaid at checkout. That’s stated intent rather than observed behaviour.[33]
- Among 2,006 US shoppers who had returned an online order, 82% called free returns an important consideration, up from 76% in 2024.[34]
- 71% said they’re less likely to shop with a retailer again after a poor returns experience.[34]
- 19.3% of US online sales were expected to be returned in 2025, against 15.8% across all retail channels.[34]
- Showing prices in the shopper’s own currency raised conversion 4.7% and lifetime value per session 5.4%. That was against a 1% randomized holdback across 1.5 million subscription checkouts.[3]
- Despite that, 80% of subscription transactions are still priced in the merchant’s own default currency.[3]
- The FTC’s rule on unfair or deceptive fees took effect on May 12, 2025 and covers only live-event ticketing and short-term lodging. General ecommerce isn’t covered.[35]
Anyone telling you all-in pricing is now legally required at ecommerce checkout is wrong. The rule’s scope is narrow, though the directional pressure on hidden fees isn’t going away.
What checkout optimization is actually worth
The best-known number in this field, published current through 2026, is a 35.26% potential conversion increase. It’s a modelled ceiling from 14 years of moderated usability testing, not an observed lift.[1] The $260 billion recoverable figure is that same ceiling applied to a $738 billion combined US and EU sales base. The source’s own caveat: such gains won’t come easy.[1]
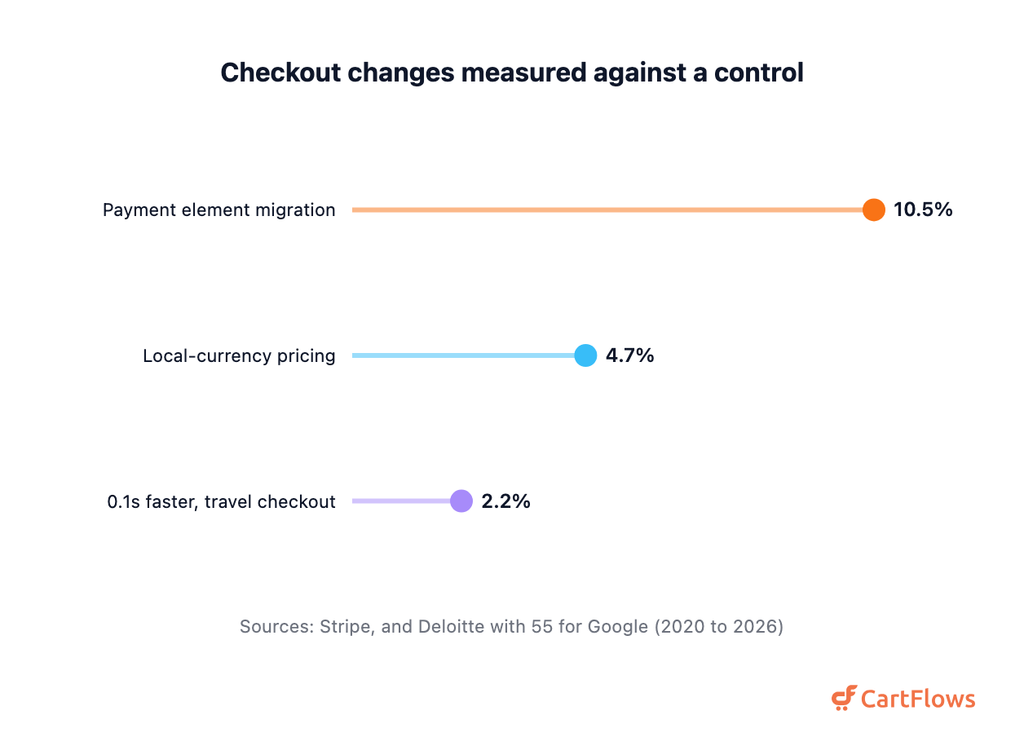
Only three checkout changes have a published lift measured against a control.
So here’s the evidence ladder, strongest first.
- Randomized holdback: surfacing an extra relevant payment method raised conversion 7.4% and revenue 12%.[3]
- Randomized holdback: local-currency pricing raised conversion 4.7%, LTV per session 5.4% and authorization rate 1.9% across 1.5 million sessions.[3]
- Natural experiment: a national 3D Secure mandate cost 0.8 percentage points of net payment success.[29]
- Matched cohort: businesses migrating to a newer payment element averaged 10.5% more revenue than 5,000 matched non-migrators. The vendor cautions that unobserved changes may be included.[3]
- Large-corpus observational: across 173,000 true experiments at 1,200+ companies, sound experiments won 58% of the time. Poorly built ones won 35%, at 90% significance.[36]
- Also from that corpus, multivariate tests posted a median 57% uplift, on a base of only 44 tests.[36]
- One consumer platform’s program ran a 12% win rate, a 42% rollback rate and a 64% learning rate in 2025.[37]
- Commissioned economic model: a composite organization returned 182% ROI and $12.4 million net present value over three years.[38]
- Vendor pilot with no control group: up to 6% higher payment conversion across 60 enterprise businesses.[29]
- Correlational and dated: a 0.1 second mobile speed improvement was associated with 2.2% higher checkout completion in travel, on 2019 data.[39]
- Modelled ceiling: the average benchmarked site still carries 32 distinct checkout improvements, with 0% of sites reaching a perfect score.[1]
- The backdrop matters too. New visitors converted at 1.7% against 2.9% for returning ones, both down year over year while acquisition cost rose 9%.[10]
That 42% rollback rate deserves more attention than it gets. It’s the clearest available measure of harm prevented, since almost half of tested changes were never shipped. If you’re setting up your own tests, our A/B testing guide covers the setup.
Checkout statistics that don’t hold up
Eleven of the most-repeated checkout statistics fail a provenance check. Most still rank on page one somewhere. We traced each one back through its citation chain. Some end at a study saying something different. Some don’t end anywhere.
- “One second of delay costs 7% of conversions” comes from a Spring 2017 retail performance report. The original press release is no longer reachable. The measured 2026 equivalent is about 3.5% per 100 milliseconds of LCP.[4]
- “53% of mobile visits are abandoned if a page takes over 3 seconds” is a September 2016 analysis of ad-supported publisher pages. Those aren’t ecommerce checkouts.[40]
- “Deloitte found 0.1 seconds improves conversion 8.4%” keeps getting republished as a current study. The data was collected at the end of 2019. The only checkout-stage figure in it is a 2.2% travel number.[39]
- “Trust badges lift conversion 15% to 30%” is credited to Baymard and appears on no Baymard page. Baymard’s own seal test found a homemade fake seal beating most real ones.[1]
- “The average checkout has 14.88 form fields against an optimal 7 to 8” is the 2016 wave. The current field count is 11.3 against an optimum of 8.[1]
- “Checkouts average 23.48 fields” miscounts the unit. That 2016 figure counts form elements, including checkboxes, drop-downs and radio buttons.[1]
- “Completion drops 4% to 6% for every field past the eighth” is attributed to Baymard and absent from Baymard. The one published regression on this question found field count had no effect on conversion rate.[2]
- “BNPL lifts average order value 20% to 85%” traces entirely to uncontrolled vendor marketing. The only peer-reviewed estimate is a 10% basket increase.[24]
- “False declines cost $443 billion globally in 2025” is a 2019 report projecting that figure for 2021. The measured rate is 1.51% of sales.[28]
- “Shop Pay lifts conversion up to 50% versus guest checkout” rests on an unnamed consulting firm’s unpublished study. No sample, control or test design was disclosed.[4]
- “Checkout optimization increases conversion 35%” restates a modelled full-remediation ceiling as a measured average, which the publisher never claimed.[1]
Two more that we couldn’t cite because there’s nothing to cite. “Money-back guarantees lift conversion 5% to 15%” has no named source or methodology anywhere. No controlled study of guarantee visibility at checkout exists. “ASOS lifted conversions roughly 50% with guest checkout” is folklore with no published test behind it.
What these share is simple. Each one is more quotable than the real finding it replaced. Each survived because nobody clicked through two hops.
Building or rebuilding checkout on WordPress? Our WordPress funnel builder handles the flow, fields and layout side of everything you’ve just read.
Sources and methodology
Every figure was read on the page of the organization that produced it, across roughly 37 primary publishers. Six were read on a commissioning publisher’s page instead, because the producer doesn’t post the figure. We dropped 99 figures, mostly fabricated Baymard attributions, vendor claims with no disclosed test design, and 2016 to 2019 numbers re-dated as current.
Three disclosures. Baymard is the upstream for roughly a fifth of these references, and it publishes conflicting values for the same guideline across its own pages: 94% against 98% for missing adaptive error messages, 39% against 49% for unexplained phone fields. We publish the most recent value, cite its exact page, and don’t average.
Form fields and form elements aren’t the same unit, so 11.3 fields and 19.9 elements never share a comparison. The 35.26% uplift figure is a model output, not a measurement.
Four gaps stayed open. There’s no controlled test of trust badges at checkout, none of money-back guarantees, no verified free-shipping threshold, and no verified wallet-brand US share.
Last updated: September 18, 2026.
Final Thoughts
Two things stood out while we were putting this together. The first is how much of the checkout canon rests on numbers that were modelled rather than measured. They got repeated until the caveat fell off. The most famous figure in the field is the clearest case, and it’s quoted almost everywhere without the word “potential” attached.
The second is more useful. The checkouts that do well aren’t doing anything exotic. They ask for less, they explain what they ask for, they load fast, and they don’t make you make an account. That’s unglamorous work, and it’s still where most of the available gain sits.
So ask who measured it, when, and on what sample. Then go fix your own form.
Frequently Asked Questions
References
- Baymard Institute, baymard.com
- Zuko Analytics, zuko.io
- Stripe, stripe.com
- Shopify, shopify.com
- Adobe Analytics, news.adobe.com
- Worldpay, worldpay.com
- Web Almanac, almanac.httparchive.org
- Littledata, littledata.io
- Dynamic Yield, marketing.dynamicyield.com
- Contentsquare, contentsquare.com
- Google, developer.chrome.com
- Auth0, auth0.com
- Incisiv, via BigCommerce, bigcommerce.com
- PageSpeedMatters, pagespeedmatters.com
- BigCommerce, bigcommerce.com
- Payments Dive, paymentsdive.com
- Global Payments, investors.globalpayments.com
- GlobalData, investors.globalpayments.com
- PYMNTS Intelligence, pymnts.com
- Merchant Risk Council, merchantriskcouncil.org
- Federal Reserve Board, federalreserve.gov
- Consumer Financial Protection Bureau, consumerfinance.gov
- Richmond Fed, richmondfed.org
- Journal of Marketing, via Imperial College London, imperial.ac.uk
- New York Fed, newyorkfed.org
- Fastly, fastly.com
- Signifyd, signifyd.com
- Datos Insights, via Signifyd, signifyd.com
- Adyen, adyen.com
- Ravelin, ravelin.com
- Route, route.com
- eMarketer, emarketer.com
- Landmark Global, via Yahoo Finance, finance.yahoo.com
- NRF, nrf.com
- Federal Trade Commission, ftc.gov
- Optimizely, optimizely.com
- Spotify, confidence.spotify.com
- Forrester, tei.forrester.com
- Deloitte and 55, via web.dev, web.dev
- Google and DoubleClick, thinkwithgoogle.com