The median landing page converts at 6.6%, measured across 41,000 pages and 464 million visits.[1] That’s the anchor for this page: 170+ verified statistics on conversion rates, traffic sources, cost per lead, forms, speed, video and trust signals.
We traced every number to the organization that measured it. The page a click lands on is still the most neglected asset in paid marketing, and it’s the cheapest one to fix.
Landing page numbers that matter
- The median landing page conversion rate across all industries is 6.6%, on 41,000 pages.[1]
- A landing page rate of 10% or above counts as good, roughly 1.5x the 6.6% all-industry median.[2]
- Entertainment pages convert at a 12.3% median against 3.8% for SaaS, a 3.2x spread.[1]
- 53% of paid media marketers send most paid traffic to a generic destination, not a purpose-built page.[3]
- 62% of marketers who send paid traffic to their homepage fail to beat their ROI goals.[4]
- Only 45% of mobile home pages pass Core Web Vitals, against 56% of mobile secondary pages.[5]
- 83% of landing page visits happen on mobile, yet desktop converts about 8% better.[6]
- Signup form conversion holds flat near 2.1% through three fields, then falls to 1.5% at four.[7]
- Only 32% of marketers who run A/B tests apply them to landing pages, against 60% for the website.[8]
- The claim that 40+ landing pages produce 500% more leads appears nowhere in the report it is credited to.[9]
- Landing page numbers that matter
- Landing page conversion benchmarks
- Conversion rates by industry
- Conversion rates by traffic source
- What a landing page lead actually costs
- The post-click gap
- Page speed and Core Web Vitals
- Mobile versus desktop performance
- Forms and form fields
- Copy, readability and attention
- Video on landing pages
- Social proof and trust signals
- A/B testing and landing page optimization
- AI search and landing page traffic
- Landing page statistics that don't hold up
- Sources and methodology
- Final Thoughts
- Frequently Asked Questions
- References
Landing page conversion benchmarks
Across 41,000 landing pages and 464 million visits measured between July 2023 and July 2024, the median conversion rate was 6.6%.[1] Pages at or above 10% count as good, about 1.5x that median.[2] What sits underneath the median matters more, and it’s wide.
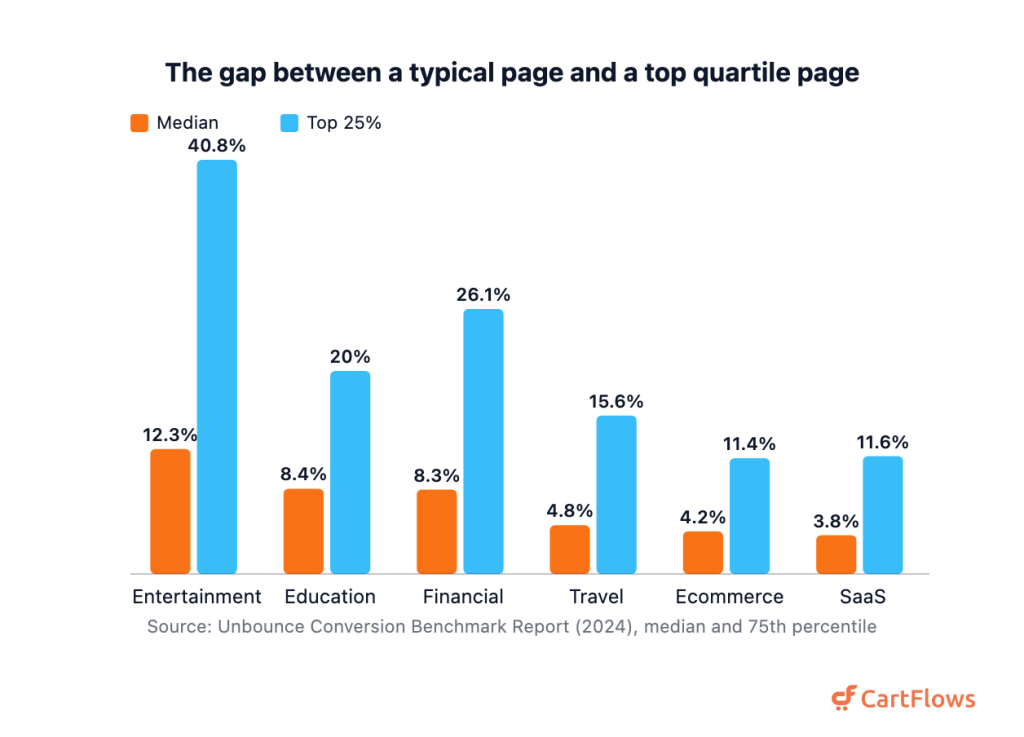
The gap between a typical page and a top quartile page
- 41,000 landing pages, 464 million visits and 57 million conversions make up the dataset behind the 6.6% median.[10]
- Pages with under 50 visitors were excluded from that benchmark, along with categories holding under 400 pages, before any median was calculated.[10]
- Top-quartile landing page conversion rates span 11.4% to 40.8% across the nine industries measured.[1]
- 3.8% to 12.3% covers every industry median in that dataset. That’s a 3.2x gap from the lowest vertical to the highest.[6]
- The 2020 edition of the same benchmark put the median landing page conversion rate at 3.2%. Its mean was 9.7%, roughly 3x higher.[11]
- Marketers report a median 7.84% conversion rate on their own landing pages, and the top quartile reports 14.9%.[12]
- About half of surveyed companies said their landing pages convert at 10% or less.[12]
- 21.52% of surveyed companies couldn’t state their own landing page conversion rate.[12]
- 5.13% is the average website conversion rate across 13 industries, where a conversion means a qualified lead or a sale.[13]
- 1.4% of global ecommerce visits converted in the second quarter of 2026.[14]
- 1.4% was the average whole-store Shopify conversion rate in 2023. Mobile ran 1.2%, desktop 1.9% and the top 10% of stores 4.7%.[15]
- 2.9% of returning visitors converted against 1.7% of new ones, so returning traffic converts about 71% better.[16]
That 9.7% mean from 2020 is where the inflated headline numbers on competing pages come from. Means get dragged upward by a few outliers. But medians don’t.
Self-reported figures run high too, and a fifth of companies can’t produce one at all. Our sales funnel statistics and ecommerce conversion rate statistics cover the stages either side of the page.
Conversion rates by industry
Entertainment led all nine industries measured with a 12.3% median landing page conversion rate, while SaaS came last at 3.8%, a 3.2x spread in the 2024 benchmark data.[1] Your vertical tells you more than the all-industry median, and the subcategory splits tell you more still. Don’t stop at the top line.
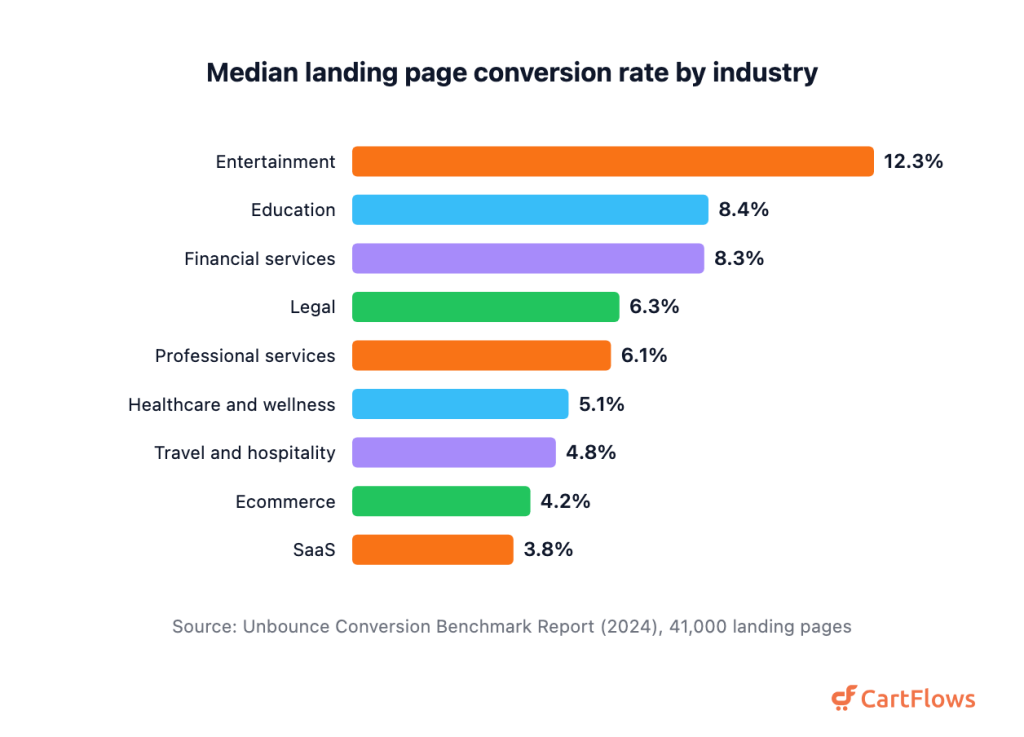
Median landing page conversion rate by industry
- Education landing pages converted at a median 8.4%, with the top quartile starting at 20%.[17]
- At 8.3%, the financial services median lands just below education, and its top quartile starts at 26.1%. Secondary sources often swap the two.[18]
- 6.3% is the median for legal landing pages, close to the all-industry baseline. Legal’s top quartile begins at 13.1%.[19]
- Commercial and professional services pages landed on a 6.1% median, with a top quartile of 14.1%.[20]
- The median for healthcare, wellness and medical landing pages stands at 5.1%.[21]
- The travel and hospitality median came in at 4.8%, with its top quartile starting at 15.6%.[22]
- 4.2% is the ecommerce median, and the top quartile of ecommerce pages starts at 11.4%.[23]
- At 3.8%, SaaS sits lowest of the nine industries and 42% below baseline. Its top quartile starts at 11.6%.[24]
- Insurance pages topped every subcategory in that dataset at 18.2%, converting 119% better than the wider financial services median.[18]
- Inside that same finance vertical, credit and lending pages hit an 8.8% median against 3.9% for investing pages.[18]
- 18.3% marks the median for online course pages, against 4.9% for primary education and tutoring. General courses sit at 13% and higher education at 6.3%.[17]
- The accommodation median stops at 3.7% while transportation and travel services reach 14.8%, a 4x spread inside one vertical.[22]
- Food and beverage recorded a 7.1% median inside ecommerce. Auto and industrial parts followed at 5.1%, fashion and beauty at 1.3%, a 5.5x spread.[23]
- 8.2% is the wellness median, against 5.3% for medical treatment and 4.3% for dental. Half of all dental pages fall between 2% and 8.3%.[21]
- 16.22% was the highest post-click conversion rate on US Google Ads search campaigns in 2026, in animals and pets. Finance and insurance came last at 2.64%, a 6.1x spread.[25]
- 15.51% was the automotive repair post-click conversion rate on that same sample of 13,474 US campaigns. Education hit 13.14%, dentists 10.67%, real estate 3.70% and furniture 2.99%.[25]
- Legal recorded the best website conversion rate of the 13 industries tracked, at 7.9%. Software follows at 7.6%, finance 6.3%, real estate 2.8%, retail 2.4% and travel 1.9%.[13]
- Across 27 B2B industries, legal services posted the highest landing page conversion rate at 3.4%. Aviation and biotech sit lowest at 1.0%, and B2B SaaS at 1.1%.[26]
- Food and beverage again tops ecommerce conversion rates by product category at 6.22%, against 0.94% for luxury and jewelry.[27]
- Customer-type pages hold a 3.5% visitor-to-known-lead rate against 1.1% for location pages. Application pages convert at 3.1%, product 2.9%, service 2.7% and industry 1.8%.[26]
One pattern repeats inside every vertical. The bigger the ask, the lower the rate. So an online course converts at 18.3% while a degree program manages 6.3%, and that’s a difference in commitment, not copywriting.
Conversion rates by traffic source
AI referral traffic was the highest-converting source measured in 2026, at 5.8%, a channel that didn’t exist in earlier editions of the same benchmark.[13] Paid search followed at 5.4%. Social sits at the bottom of every dataset we checked, by a wide margin.
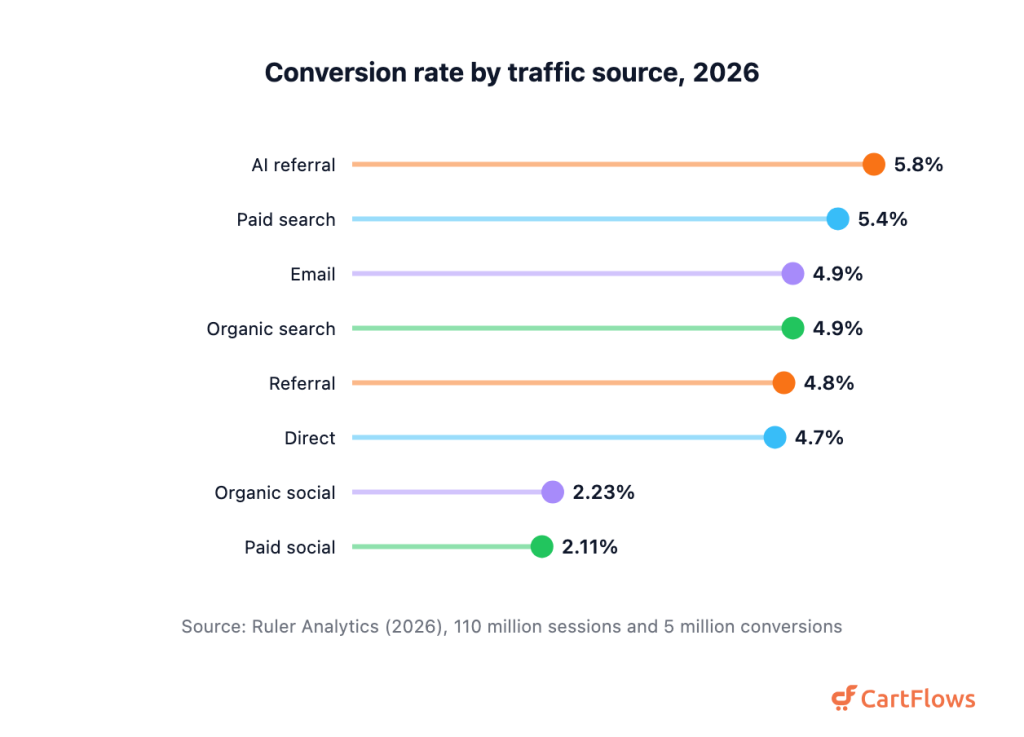
Conversion rate by traffic source, 2026
- 5.4% was the website conversion rate for paid search traffic across 110 million sessions. Email and organic search followed at 4.9%, referral at 4.8% and direct at 4.7%.[13]
- Organic social traffic converted at 2.23% and paid social at 2.11%, the lowest-converting group in that dataset.[13]
- 19.3% is the average landing page conversion rate for email traffic, the strongest channel on the 41,000-page dataset.[6]
- 60%, 77% and 370% are how much better email visitors convert on landing pages than paid social, paid search and display visitors do.[6]
- Paid social traffic converts at an average 12% on landing pages, against 10.9% for paid search.[6]
- 11.3% of Google paid search visitors converted on the landing page, 41% better than Bing and 95% better than Yahoo.[6]
- Among paid social platforms, Instagram leads landing page conversion at 17.9% and Facebook follows at 13%. YouTube, TikTok and X land between 6% and 9%, with LinkedIn lowest.[6]
- Site-wide conversion for paid search ran 2.8% across 6,500 sites, with AI referrals at 1.3% and organic social at 0.7%. AI referrals rose 55% year over year.[16]
- 10.6% fewer conversions came from businesses that increased their reliance on paid social. Those businesses also saw a 9.2% higher bounce rate and 8.7% fewer page views.[28]
- 2.6% is the B2B conversion rate on organic search against 2.1% for B2C, and 2.3% against 1.3% on webinars.[29]
- B2B converts at just 0.9% on paid social against 2.1% for B2C, the one channel where B2C wins.[29]
Notice how far apart the two paid social readings sit. One measures conversion on the landing page itself, so a page built for that traffic performs. The other measures whole sites. Same channel, and it’s the destination that differs.
What a landing page lead actually costs
The average Google Ads cost per lead across all industries fell to $66.69 in 2026, down from $70.11 the year before.[25] That’s the first decline in five years, and conversion rates rose in the same period.
- 8.18% was the average Google Ads conversion rate in 2026, up from 7.52% the year before.[25]
- 87% of industries saw their Google Ads conversion rate increase year over year.[25]
- Search advertising clicks cost $5.42 on average, at a 6.64% click-through rate.[30]
- Legal services pay $131.63 per Google Ads lead against $26.84 for arts and entertainment, a 4.9x gap.[25]
- Travel cost per lead fell 39.35% on Google Ads that year, while automotive for sale rose 13.90%.[25]
- $27.66 was the average cost per lead on Meta lead-generation campaigns, at a 7.72% conversion rate. Clicks cost $1.92 there against $0.70 on traffic campaigns.[31]
- Restaurants posted the best conversion rate on Meta lead campaigns at 18.25%, down to 3.77% for furniture across 726 campaigns.[31]
- $76.71 was the cost per lead for dentists on those same Meta campaigns, against $3.16 for restaurants.[31]
- B2B SaaS carries a blended cost per lead of $237, at $310 paid and $164 organic. So a paid lead runs about 1.9x an organic one.[32]
- $91 is the blended cost per lead for ecommerce, at $98 paid and $83 organic. That’s roughly a third of the B2B SaaS figure.[32]
- The combined customer acquisition cost for B2B SaaS sits at $239, at $205 organic and $341 inorganic.[33]
- Across ecommerce subcategories, customer acquisition cost runs $53 to $91, with food and beverage lowest and jewelry highest.[34]
- Cost per online visit rose 9% while site conversion rate fell 6.1%, across 6,500 measured sites.[28]
Those last figures pull against the paid search numbers above. And we’re not going to average them, because one measures whole sites across all traffic while the other measures campaigns with a defined post-click destination.
These aren’t competing claims: site-wide conversion drifts down while purpose-built paid funnels get better.
The post-click gap
More than half of paid media teams send most of their paid traffic to a generic destination rather than a purpose-built page, 53% as of May 2026.[3] That’s the post-click gap: budget spent winning the click, then handed to a page nobody built for it.
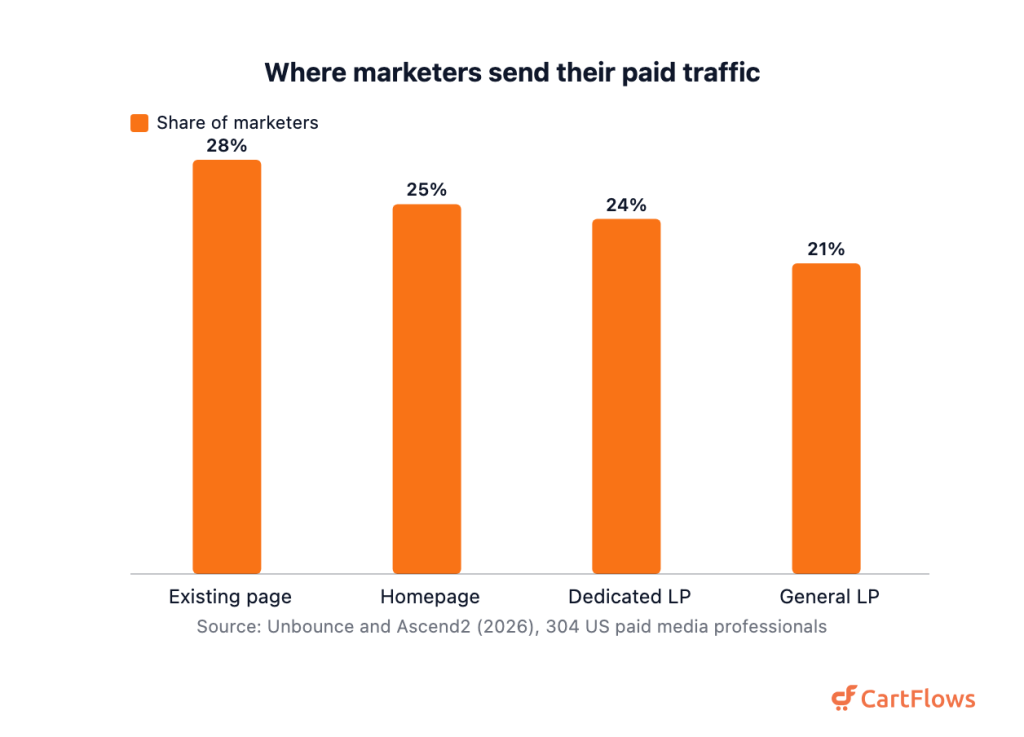
Where marketers send their paid traffic
- 28% of paid media marketers send most paid traffic to an existing website page, and 25% send it to the homepage.[3]
- Only 24% of paid media teams primarily use a dedicated campaign landing page, and 21% use a general reusable one.[3]
- 40% of surveyed paid media marketers call optimizing destination pages one of the most effective ways to maximize paid spend. Yet only 31% invested in landing pages in the past six months.[35]
- 62% of marketers who send paid traffic to their homepage fail to exceed their ROI goals.[4]
- 4.5x is how much more likely the marketers most confident in their landing pages are to exceed paid media ROI targets.[36]
- Only 46% of paid media marketers report ROI above target at all.[36]
- 31% of marketers with high landing page confidence significantly exceed their ROI targets, against 7% of those with low confidence.[4]
- 90% of paid media marketers report budget or resource constraints. When those constraints bite, testing gets cut first at 30% and landing page creation at 26%.[3]
Read those together and the picture’s blunt. Marketers know the destination page decides the return, and they’ll say so in surveys. But they still cut it first when money gets tight.
The gap doesn’t close at the landing page either. Whatever the page promises, checkout is where it gets paid, and our cart and checkout abandonment statistics go deeper on that handoff.
- 70.22% is the average documented online cart abandonment rate, from a meta-analysis of 50 studies.[37]
- 42% of cart abandoners were just browsing, while 17% blamed a checkout that was too long or complicated.[38]
- 11.3 form fields and 5.1 steps make up the average ecommerce checkout, against an optimal 8 fields. Step count hasn’t moved since 2012.[39]
- Field count predicts checkout performance better than step count does.[39]
- Large ecommerce sites can gain an average 35.26% in conversion from checkout design fixes alone. Auditors found 39 improvement areas per site.[38]
- 44% of ecommerce sites make guest checkout needlessly hard to find, so users wrongly assume registration is required.[40]
- 64% of more than 180 leading ecommerce sites scored mediocre or worse on checkout UX, and 21% accept only one payment method.[41]
- No one-page against multi-step checkout figure gets published at all, because the studies favouring one-page flows usually compare an unoptimized multi-step checkout with a newly optimized one-page one.[42]
- 48.3% of all ecommerce systems and 8.1% of all websites run WooCommerce.[43]
- 41.0% of all websites and 59.0% of known-CMS sites run WordPress, roughly 7.7x the next platform, with Shopify at 5.3% and Wix at 4.3%.[44]
- 18.6% of known-CMS sites use Elementor, the most widely deployed WordPress page builder.[45]
- Order bumps see an average take rate of 30% to 40%, on vendor platform data covering more than $7 billion processed.[46]
- A single post-purchase upsell lifted average order value 68.1%, again on vendor platform data. There, 58% of revenue comes from upsell transactions.[47]
- 45% was the average checkout completion rate for Shopify stores in 2023. Mobile ran 44%, desktop 49% and the top 10% of stores 66%.[48]
So that refusal to publish a one-page checkout number is worth more than the number would be. It’s a straight admission that most flow-design statistics in circulation compare an old page with a new one, then credit the layout.
Page speed and Core Web Vitals
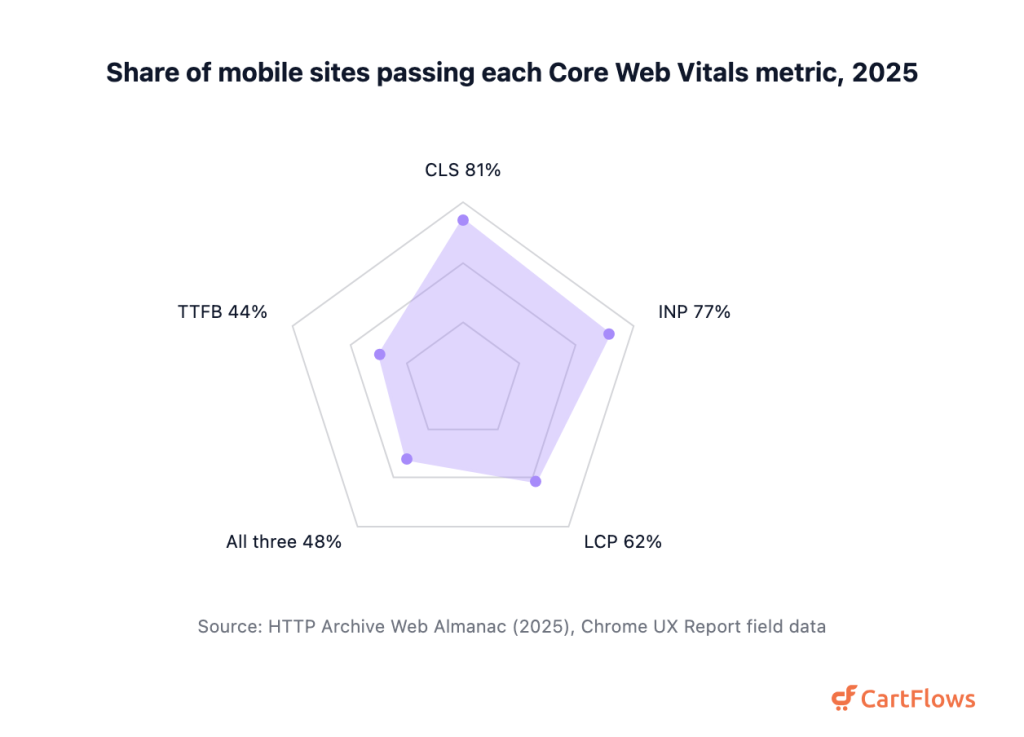
Only 48% of mobile sites and 56% of desktop sites passed all three Core Web Vitals in 2025, up from 44% and 55% a year earlier.[5] The good thresholds are 2.5 seconds for LCP, 200 milliseconds for INP and 0.1 for CLS.[49] Most sites still don’t clear them on mobile.
Share of mobile sites passing each Core Web Vitals metric, 2025
- 62% of mobile pages achieve a good largest contentful paint, against 74% of desktop pages. Mobile also carries nearly double the rate of poor experiences, 13% against 7%.[5]
- 77% of mobile sites have a good interaction to next paint, against 97% of desktop sites. That 20 point gap lands on forms and buttons.[5]
- Good cumulative layout shift covers 81% of mobile pages, against 72% of desktop pages. It’s the one vital where mobile wins, up from 62% in 2021.[5]
- 44% of mobile sites have a good time to first byte, against 55% of desktop sites.[5]
- 45% of mobile home pages pass Core Web Vitals, against 56% of mobile secondary pages. So entry pages are the slowest pages on a site.[5]
- 1,916 milliseconds is the median total blocking time on mobile against 92 milliseconds on desktop. That 21x gap widened from 1,209 milliseconds in 2024.[5]
- The median mobile home page now weighs 2.6 MB, up 8.4% year over year. That includes 911 KB of images and 646 KB of JavaScript.[50]
- 62% of mobile pages fail to set dimensions on at least one image, the most common cause of layout shift.[5]
- Ecommerce pages loading in one second converted at 3.05%, against 0.67% at four seconds. The rate falls about 0.3 points per extra second.[51]
- A 0.1 second mobile speed improvement lifted retail conversion 8.4% in 2019, with travel at 10.1%. Progression from a lead form’s first step to submission rose 21.6%.[52]
- 33.13% higher conversion and 53.37% more revenue per visitor came from one Core Web Vitals rebuild, in a month-long split test. Sessions with good LCP converted up to 61.13% better.[53]
- 8% more sales and a 15% better lead-to-visit rate followed a 31% LCP improvement on one landing page. The test ran against a visually identical control.[54]
- 10.9% of sessions were affected by slow page loads in 2025, down 20% year over year.[55]
- A 100 millisecond delay cut conversions 7% and a two second delay doubled bounce rate, across roughly 10 billion visits in 2017.[56]
The entry page finding is the one to act on. Your landing pages are, statistically, the slowest pages you own. And they’re the ones you paid to send traffic to.
Speed isn’t a maintenance task, it’s a conversion feature.
Mobile versus desktop performance
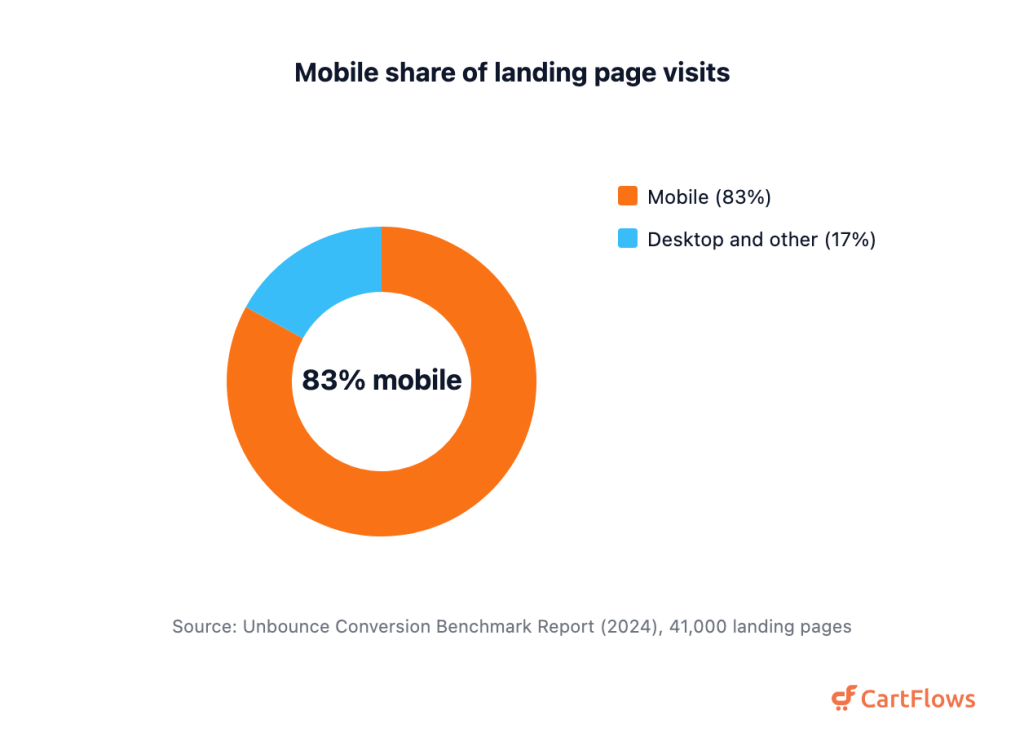
Mobile devices accounted for 83% of landing page visits on the 41,000-page dataset, yet desktop converted about 8% better on those same pages.[6] The device that brings the traffic isn’t the device that converts, and the gap widens as the decision gets bigger.
Mobile share of landing page visits
- 69.9% of all web traffic was mobile in 2026, with desktop traffic down 7.3% year over year.[57]
- Desktop converted at 3.4% across 6,500 sites against 2.0% on mobile, a desktop rate 74% higher. Desktop conversion itself fell 7.9%.[16]
- 3.7% is the desktop conversion rate in retail against 2.0% on mobile, and 4.5% against 2.1% in travel.[58]
- Almost 47% of total time on site comes from desktop, despite desktop taking under a third of visits.[58]
- Desktop sessions average 4 minutes 46 seconds, against 2 minutes 20 seconds on mobile.[58]
- The average desktop scroll rate reaches 50.5% against 45.2% on mobile, so the median mobile visitor never reaches the bottom half.[58]
- 53% of mobile visits were abandoned when a page took over three seconds, measured on simulated 3G in 2016, when the median mobile page took 19 seconds to load.[59]
But those two mobile share figures don’t reconcile, and they shouldn’t. The 83% counts visits to landing pages, where paid social and paid search skew heavily mobile. The 69.9% counts all traffic to whole sites.
So we report both. Anyone averaging them into one mobile share number is inventing a statistic.
Forms and form fields
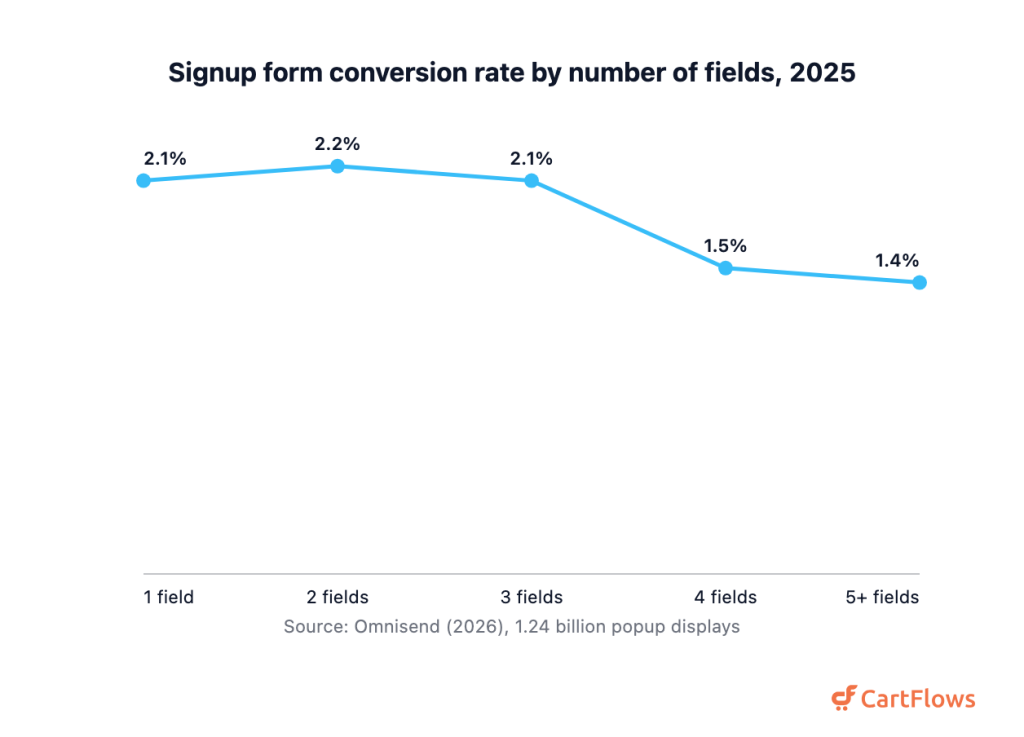
Signup form conversion held flat through three fields in 2025, at 2.1% with one field, 2.2% with two and 2.1% with three, then dropped to 1.5% at four and 1.4% at five or more, across 1.24 billion popup displays.[7] The cliff isn’t at two fields. It’s at four.
Signup form conversion rate by number of fields, 2025
- 2.1% was the average email signup form conversion rate in 2025, down from 2.3% in 2024.[7]
- Multi-step forms converted at 2.3% against 2.0% for single-step ones. That’s a 15% relative gain, nowhere near the 206% lift that circulates.[7]
- 3.5% to 3.6% is where gamified spin-to-win forms converted, against 1.9% to 2.1% for standard ones.[7]
- 2.4% of visitors signed up when the form appeared after a six to ten second delay, against 1.9% when it appeared immediately.[7]
- 2.4% of visitors signed up when the form carried a discount offer, against 1.7% when it didn’t.[7]
- 2.2% is the signup conversion rate for mobile-targeted forms against 1.4% for desktop-only ones.[7]
- 45% of people who reach a form complete it, and 66% of those who start one do, so roughly a third abandon mid-form.[60]
- Password fields drew a 10.50% mean abandonment rate, the worst of any field type across 1,362 forms. Email follows at 6.41%, phone 6.28%, name 5.27%, postcode 4.82% and address 4.32%.[61]
- Shorter forms are not automatically better, and that form-analytics data doesn’t support the claim that fewer fields always lifts completion.[60]
- Form submission rates more than triple when the same fields are spread across multiple pages, on a vendor claim published with no stated sample or year.[62]
- One major email platform puts its general benchmark signup form submit rate at 3%.[63]
- Age, phone number and street-level location depress conversion, and textareas and dropdowns hurt disproportionately, from an analysis of 40,000+ landing pages published around 2011.[64]
Here’s the part most guides skip. Field count and field type are separate problems, and the type effect is bigger. A three-field form asking for a phone number can lose more people than a five-field form asking for an email and a company name.
So don’t cut fields blindly. Cut the ones people refuse to fill in.
Copy, readability and attention
Landing pages written at a fifth to seventh grade reading level converted at 11.1%, against 5.3% for pages written at a professional level, in the 2024 benchmark data.[6] That’s more than double, and 56% better than pages pitched at eighth to ninth grade.
- Difficult words, reading time and word count are the three copy attributes most negatively correlated with landing page conversion, at 24.3%, 19.4% and 18.6%. The difficult-words effect strengthened from 15% in 2020.[6]
- 28% of the words on a page is the most users have time to read, and 20% is likelier, across 45,237 page views in 2008.[65]
- 111 words is the page length at which users read half the content, against an average page of 593 words. Each extra 100 words bought 4.4 seconds of attention in that 2008 study.[65]
- 57% of page-viewing time is spent above the fold, revised down in 2018 from the 80% the same lab reported in 2010.[66]
- 74% of page-viewing time falls in the first two screenfuls and 81% in the first three. The top fifth of the page alone takes 42%.[66]
- 65% of viewing time falls in the top 40% of the page, from that same eye-tracking work.[66]
- The first 10 seconds decide whether a visitor stays on a page. The average visit lasts a little under a minute, from 2011 analysis of 205,873 pages.[67]
- 85% of users correctly predicted where a link led from its first 11 characters. But for 35% of links they had no idea, in testing from 2009.[68]
- Eighth grade has been the standing reading-level recommendation for a broad consumer audience since 2015.[69]
- 65% of product characteristics were remembered after copy was rewritten for readability, against 33% before the rewrite, in that 2015 work.[69]
- 0% to 4% was the conversion lift at top of funnel from stripping navigation and social links, against 16% and 28% at middle of funnel. The test covered five high-traffic landing pages.[70]
- Engagement fell 10% year over year, with time on site down 7%, scroll rate down 2% and page views per session down 1%.[58]
- 5.4% is the average conversion boost for sites that increased session depth by 10% or more. Meanwhile 40% of visits showed signs of frustration.[28]
- 61% of product detail page visits bounce, and one in three visits now starts on one rather than on a home page.[58]
That navigation test replaces two numbers you’ve probably seen quoted. Removing navigation did nothing at top of funnel. But it moved the needle 16% and 28% on middle-funnel pages, where intent was already high.
Plain copy isn’t dumbed-down copy, it’s just copy that gets read.
Video on landing pages
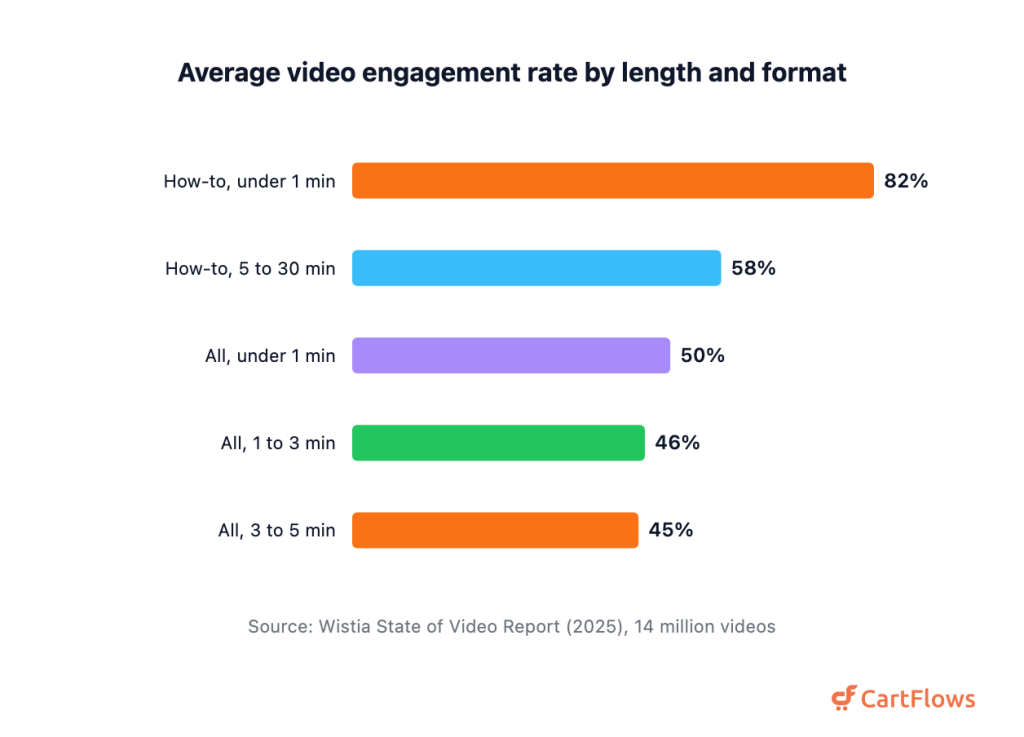
Videos under a minute held an average engagement rate of 50% in calendar 2024, falling to 46% at one to three minutes and 45% at three to five, across more than 14 million videos.[71] Shorter holds attention. But it’s format that separates the top performers.
Average video engagement rate by length and format
- 82% is the engagement rate for how-to and explainer videos under a minute, the highest of any format and length pairing. How-tos running 5 to 30 minutes hold 58%.[71]
- Nearly 40% of viewers convert on calls to action placed in the first quarter of a video under 60 seconds.[71]
- 11% is the year-over-year rise in conversion on in-video lead-generation forms, even as use of those forms fell.[71]
- Caption use on business video grew 572% between 2021 and 2024, the most widely adopted accessibility feature.[71]
- 57% of companies increased their video budget against 5% that cut it, across 1,300+ professionals surveyed.[71]
- 65% of viewers finish a business video under a minute, against 20% for one over 20 minutes, across 943,305 videos.[72]
- 943,305 videos were created in 2024, up 88%, with the average user producing 37.[72]
- 91% of businesses use video and 82% say it delivered good ROI, down from an all-time high of 93%, on a small sample of 266 marketers.[73]
- 93% of video marketers say video increased understanding of their product.[73]
None of this says video lifts conversion by a fixed percentage. It says short instructional video keeps people watching, and that an early call to action in a short video gets acted on. So the honest claim is narrower than the one you’ll see quoted.
Social proof and trust signals
A product with five reviews was 270% more likely to be purchased than the same product with none, measured in 2017.[74] Marginal benefit falls sharply after those first five, so the opening handful does most of the work. After that you’re adding volume, not persuasion.
- 190% is the conversion lift from reviews on lower-priced products, against 380% on higher-priced ones. So social proof counts about twice as much as perceived risk rises.[74]
- Purchase likelihood peaks between 4.0 and 4.7 stars and then declines toward 5.0, in that same 2017 analysis.[74]
- 95% of consumers regularly read product reviews and 96% rank them the most influential purchase factor, across 21,279 consumers in 2025.[75]
- Only 43% of consumers would buy a product that has no ratings or reviews at all.[75]
- 62.7% of consumers trust online reviews as much as or more than recommendations from friends and family.[75]
- 52.2% is how much more likely a product page with one to ten reviews is to convert than one with none. The lift reaches 296.2% at 5,000 reviews or more, from 2021 analysis of 1.5 million product pages.[76]
- 42% of US consumers trust reviews as much as personal recommendations, down from 79% in 2020.[77]
- Only 4% never read online business reviews, and 74% consult two or more review sites before deciding.[77]
- 7% of all reviews submitted to one major platform in 2024 were fake, with 4.5 million removed and 90% of detections automated.[78]
- 19% of US shoppers abandoned a checkout because they didn’t trust the site with their card details.[79]
- 89% of people held misconceptions about what the browser padlock means. Only 23% to 44% referenced it at all, across 1,880 participants.[80]
- 90.1% of all websites use HTTPS by default, which is why its presence no longer differentiates anything.[81]
- Norton drew about 36% of trust-seal preference and McAfee 23%, but 49% had no preference at all, in a 2013 survey of 2,510 responses.[82]
- 11.8% of cookie consent pop-ups meet the minimal requirements of European law, from peer-reviewed 2020 analysis of the top 10,000 UK sites.[83]
- Removing the opt-out button from a cookie banner’s first layer raised consent 22 to 23 percentage points. Adding granular controls lowered it 8 to 20 points, in that same 2020 study.[83]
- 12.5% of consumers became invisible to a marketing intermediary once opt-in consent arrived. So consent removes about one in eight users from analytics and retargeting.[84]
The star rating finding still surprises people. Because a flawless 5.0 reads as filtered rather than honest, chasing it isn’t the win it looks like.
And the trust badge era is over. When 90.1% of sites are encrypted and 89% of users misread the padlock, a seal in your footer isn’t what’s convincing anyone.
A/B testing and landing page optimization
Among marketers who run A/B tests, only 32% apply them to landing pages, against 60% who test the website overall, 57% email and 41% paid social, from a 2025 survey of 402 marketers.[8] It’s the least-tested surface in marketing.
- 84% of marketers who run A/B tests do so at least monthly, with 38% testing weekly and 22% daily.[8]
- 99% of those marketers call their testing programme at least somewhat successful, and 49% call it very successful.[8]
- 51% of those running tests name limited traffic for statistical significance as their main obstacle, ahead of resources at 47%.[8]
- 46% of testing teams keep a documented strategy that gets updated regularly.[8]
- 92% of those marketers say AI tools improved their testing process, and 46% say the improvement was significant.[8]
- Only 20% of small and mid-sized businesses test monthly or more, and only 32% test landing pages at all. A further 51% say they lack the resources.[85]
- Only 12% of experiments win on their primary metric, across more than 127,000 experiments.[86]
- About 20% was the stated client win rate for experiments in 2021, falling to 10% for revenue-tied ones. Between 35% and 40% of tests reached a conclusion.[87]
- 40% of test variations beat the control in travel, rising to 60% to 70% in gaming and sports. SaaS accounts run 24 to 60 tests a year.[88]
- 30% is the average gain in sales and signups from AI traffic routing that sends each visitor to the likeliest variant. That’s vendor platform data from 2020.[89]
- 31% of small-business marketers use AI-driven design or layout recommendations on landing pages, the most common AI tactic they report.[90]
- Only 19% of paid media marketers use AI for landing page creation or optimization, though 86% use AI somewhere in paid media.[35]
- Marketers who beat their ROI goals were about twice as likely to use AI on landing pages.[35]
Put the 99% satisfaction figure next to the 12% win rate. Both are real, and the tension between them is the whole discipline. But most tests lose, and a programme that expects to lose is the one that’ll find the winners.
Setting this up? A/B split testing for funnel steps handles the mechanics, and our A/B testing guide covers sample size and when it’s time to call a test.
AI search and landing page traffic
Google AI Overviews appeared on 6.49% of tracked queries in January 2025, peaked at 24.61% in July and settled at 15.69% by November, across more than 10 million keywords.[91] The click effects are measurable, and they’re moving fast in one direction.
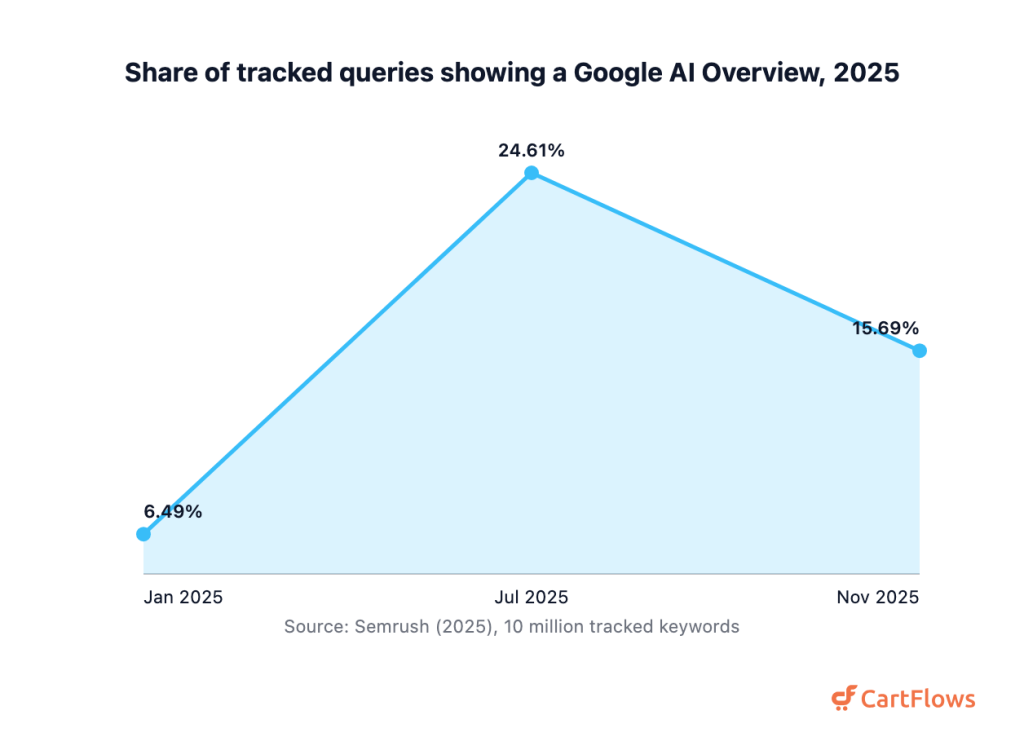
Share of tracked queries showing a Google AI Overview, 2025
- 34.5% is how much lower the average click-through rate runs for the top-ranking page when an AI Overview is present. That’s March 2025 data across 300,000 keywords.[92]
- 58% was the drop when that same methodology was re-run against December 2025 data. Position-one click-through fell from 0.073 to 0.016.[93]
- 8% of users clicked a traditional search result when an AI summary was present, against 15% when it wasn’t. Just 1% clicked a link inside the summary.[94]
- Measured zero-click rate on AI Overview keywords actually fell from 33.75% to 31.53% after the feature appeared.[91]
- 27.2% of US search traffic ended without a click in the first quarter of 2025, up from 24.4% a year earlier.[95]
- AI-referred traffic grew 66% in 2025, from 462 million to 767 million monthly visits, against 2.38% growth for organic search. It still accounts for only 0.14% of all web traffic.[96]
- Retail AI traffic grew 343% and Google AI Mode went from 1,600 to 38.2 million visits in the same period.[96]
- 4.4x is how much more valuable the average AI search visitor is than the average organic visitor, measured on conversion rate.[97]
- 53.6% of AI-referred traffic bounces, even with those referrals up 632% year over year.[57]
- 86.4% of marketing teams now use AI somewhere, and only 1.7% neither use it nor plan to, across 1,500+ marketers.[98]
- 93.2% say personalized experiences drove more leads and purchases, yet only 12.6% practice hyper-personalization.[98]
- 89% of B2B marketers use AI content tools but only 39% report improved content performance, across 1,015 marketers.[99]
That zero-click finding doesn’t fit the panic. On keywords where AI Overviews appeared, measured zero-click rates went down rather than up, which suggests the feature landed on queries that were already answer-shaped.
But two things hold at once. Fewer clicks per impression, and a much higher value per click that arrives. A visitor worth 4.4x the average organic one shouldn’t land on a homepage.
Landing page statistics that don’t hold up
Ten of the most-repeated landing page statistics fail a provenance check, and every one still ranks on page one somewhere. We traced each back through its citation chain to the original document. Some end at a study saying something different, and some don’t end anywhere at all.
- “Multiple offers convert 266% lower” has no primary source. The trail runs from one ranking page to the next and terminates without a study, the 41,000-page dataset it’s credited to contains no such finding, and a 266% decrease is arithmetically impossible.[6]
- “Video lifts conversions 86%” traces to one EyeView Digital test on a TutorVista page that already had video. The 86% came from adding a post-roll animated arrow pointing at the subscribe link, published in July 2014.[100]
- “The average landing page has 11 form fields, and cutting to 4 lifts conversions 120%” is one Chicago web firm’s own contact form in 2008, comparing two non-concurrent two-month windows totalling 36 conversions. It wasn’t an A/B test.[101]
- “40+ landing pages means 500% more leads” appears nowhere in the report text. It’s a reading of an unlabelled index chart, which is why an irreconcilable 12x version circulates alongside it.[9]
- The real finding behind that claim is 55%, fielded in July and August 2012, and the report’s own unquoted caveat is that moving from one to five pages up to six to ten produces no increase at all.[9]
- “80% of people remember what they see and 20% what they read” aren’t research findings. Edgar Dale’s 1946 Cone of Experience contained no numbers, and the percentages trace to 1914 and 1922 in dozens of contradictory permutations.[102]
- “Viewers retain 95% of a video message against 10% of text” was, by the publisher’s own admission, a small non-peer-reviewed survey of about 200 B2B buyers run by a marketing agency in the late 2000s.[103]
- “The average attention span is 8 seconds, less than a goldfish” was never a Microsoft finding. It sits on slide 6 of a Microsoft Canada report credited to Statistic Brain, whose own named sources told reporters they had no record of it.[104]
- “A one-second delay costs 7% of conversions” traces to an Aberdeen Group study published in December 2008, and it measured web applications rather than landing pages.[105] The similar-looking 7% belongs to a 100 millisecond delay in a measured 2017 study.[56]
- “77% of landing pages are really homepages” comes from a study of already-ranking local landing pages in 50 US metros, and sources citing it directly report 65% and roughly 76%, not 66% and 77%.[106]
- “The brain processes an image in 13 milliseconds” describes above-chance detection of a pre-named target concept, where 13 milliseconds was the monitor’s refresh floor rather than a measured limit. The study compared no images with text.[107]
Notice what these share. Every one is more quotable than the real finding it replaced. And each survived because nobody clicked through two hops.
Building these pages on WordPress? Our WordPress funnel builder and conversion-optimized funnel templates handle the build, and if you’re improving pages that are already live, our funnel optimization strategies cover what to change first.
Sources and methodology
Every figure here was read on the page of the organization that produced it, across more than 45 distinct primary publishers, or where a report isn’t publicly posted, on the most direct published record of it. We didn’t take numbers from aggregators repeating other people’s data.
We dropped 50 figures that couldn’t be traced to a primary source, and corrected or explicitly re-dated 12 more. The claim that cutting a form from 11 fields to 4 lifts conversions 120% is one of the dropped ones. It’s a single firm’s own contact form in 2008, measured across two non-concurrent windows totalling 36 conversions.
Two tensions stay open. Unbounce puts mobile at 83% of landing page visits while Contentsquare puts mobile at 69.9% of all web traffic. Those aren’t the same population, so we report both. Site-wide conversion is also falling in Contentsquare’s panel while paid search conversion rises in WordStream’s Google Ads sample.
Final Thoughts
Two things stood out while we were assembling this page. The first is how much of the landing page canon rests on numbers nobody measured. Some of them aren’t just old, they’re older than the smartphone.
The second is more useful. The biggest documented weakness in paid marketing isn’t targeting or creative, it’s the page the click lands on. Most paid budgets still point at a homepage or a repurposed website page, and the teams that fix that are the ones beating their return targets.
That isn’t a clever tactic. It’s just where the money leaks out.
So if you take one habit from all of this, here’s the one worth keeping. Ask who measured a statistic, when, and on what sample, before you build a page around it.
Frequently Asked Questions
References
1. Unbounce
2. Unbounce
3. MediaPost, reporting Unbounce and Ascend2
5. Web Almanac
6. Unbounce
7. Omnisend
8. Ascend2
9. SlideShare
10. Unbounce
11. Unbounce
12. Databox
13. Ruler Analytics
14. Statista
15. Littledata
16. Contentsquare
17. Unbounce
18. Unbounce
19. Unbounce
20. Unbounce
21. Unbounce
22. Unbounce
23. Unbounce
24. Unbounce
25. WordStream
26. First Page Sage
27. Shopify
28. Contentsquare
29. First Page Sage
30. LOCALiQ
31. WordStream
32. First Page Sage
33. First Page Sage
34. First Page Sage
35. MarTech, reporting Unbounce and Ascend2
36. Unbounce
43. W3Techs
44. W3Techs
45. W3Techs
46. SamCart
47. SamCart
48. Littledata
49. Google
50. Web Almanac
51. Portent
53. Google
54. Google
55. Contentsquare
56. Akamai
57. Contentsquare
58. Contentsquare
59. Google
60. Zuko Analytics
61. Zuko Analytics
62. Formstack
63. Klaviyo
64. HubSpot
70. HubSpot
71. Wistia
72. Vidyard
73. Wyzowl
75. PowerReviews
76. PowerReviews
77. BrightLocal
78. Trustpilot
80. Google Research
81. W3Techs
83. Nouwens et al.
85. Unbounce
86. Optimizely
87. Optimizely
88. VWO
89. Unbounce
90. eMarketer
91. Semrush
92. Ahrefs
93. Ahrefs
95. Semrush
96. Semrush
97. Semrush
98. HubSpot
99. Content Marketing Institute
100. Unbounce
101. Imagescape
103. Insivia
104. BBC
105. Forbes
106. Landingi
107. MIT