The average customer retention rate across 11 major B2B industries stood at 72.5% in 2026.[1] That’s the anchor for this page: 110+ verified statistics on churn, repeat purchase, loyalty programs, subscriptions, and spend.
We traced every figure to the organization that produced it and dropped what we couldn’t verify. Our honest read? Most retention advice still rests on numbers nobody measured.
Retention numbers worth knowing
- Average customer retention across 11 major B2B industries was 72.5% in 2026.[1]
- For subscription businesses, annual churn of 2% to 4% is the benchmark zone, and above 5% warrants investigation.[2]
- In 2025, 63% of consumers said they would switch after one bad experience, up 9 points in a year.[3]
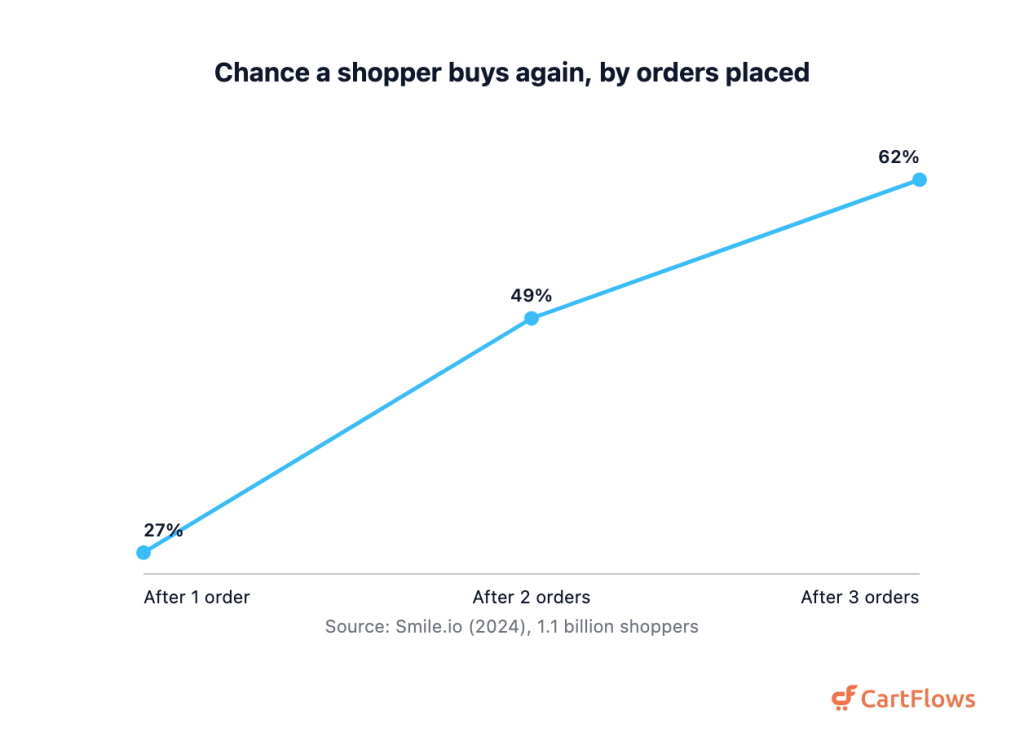
- A shopper who has bought once has a 27% chance of buying again, 49% after a second purchase and 62% after a third.[4]
- Repeat customers are 21% of an online store’s customer base but generate 44% of its revenue.[5]
- In 2026, 85% of loyalty program members said a program makes them more likely to keep buying.[6]
- Loyalty and retention now takes under 15% of total media spend, a 29% fall since 2024.[7]
- The claim that 5% more retention nearly doubles profits traces to a 1990 study of service-industry defection rates.[8]
- Retention numbers worth knowing
- Customer retention benchmarks: what good looks like
- The economics of retention, and two numbers to stop quoting
- Customer retention rate by industry
- Why customers leave
- Repeat purchase and ecommerce retention
- Subscription retention and the churn nobody chooses
- Loyalty program statistics
- The channels that bring customers back
- Retention versus acquisition: where the money goes
- Sources and methodology
- Final Thoughts
- Frequently Asked Questions
- References
Customer retention benchmarks: what good looks like
Across 11 major B2B industries, average customer retention sat at 72.5% in 2026.[1] It’s a useful anchor. The spread underneath it is wide, and subscriptions are measured on another scale entirely.
- 70% to 80% is the range a healthy annual customer retention rate falls into across industries.[9]
- 23% of its customers is what the average B2B business loses over the course of a year.[10]
- 2% to 4% annual churn is the subscription benchmark zone, with under 2% strong and above 5% worth investigating.[2]
- 1.78% annual churn or lower is top-quartile SaaS territory, against a category median of 3.22%.[2]
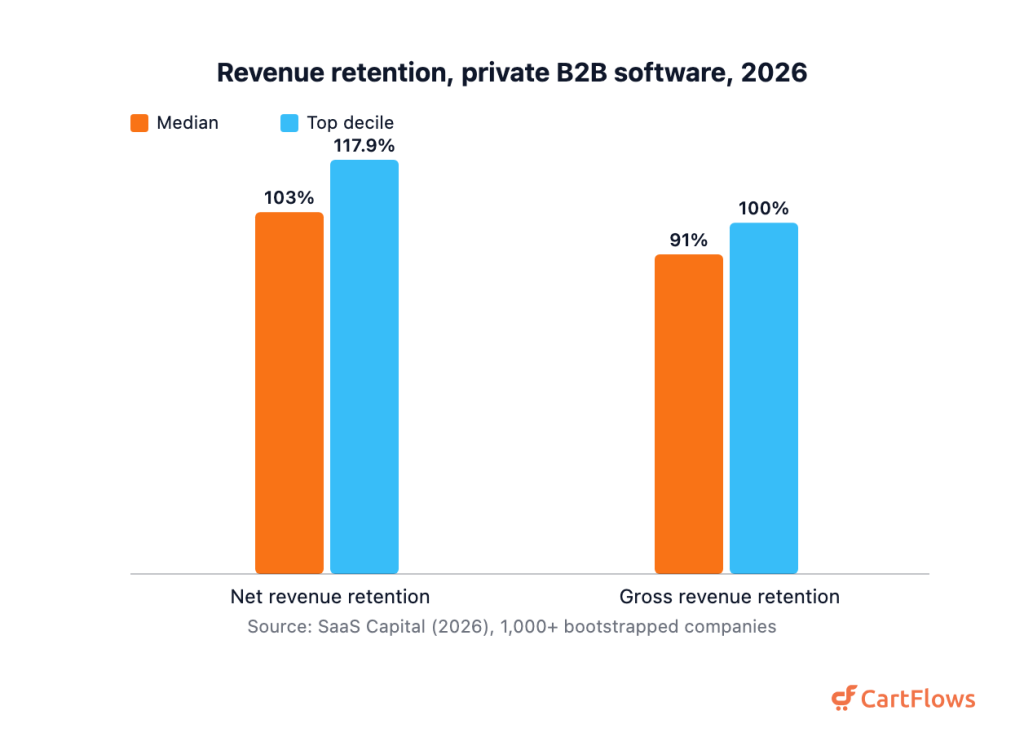
- 103% was median net revenue retention among private B2B software companies through 2026.[11]
- 117.9% net revenue retention is where top-decile performers landed in that same 2026 dataset.[11]
- 91% was median gross revenue retention across those same bootstrapped companies, with the top decile holding 100%.[11]
- 84% was median gross revenue retention across a wider SaaS panel that includes AI-native firms, down from 88% the year before.[12]
- 91% is where that wider panel’s 75th percentile landed in 2026, down from 95%.[12]
- 44% of business leaders cannot state their own company’s churn or retention rate.[10]
- 70% of companies have no view of how their customer experience work affects revenue.[13]
Those two gross-retention readings cover different populations. So we report both instead of averaging them.
Retention rate: `CRR = (customers at end of period, minus customers acquired during period, divided by customers at start) x 100`
Churn rate: `churn = (customers lost during period, divided by customers at start) x 100`
Both formulas appear identically on Shopify and CustomerGauge. Pick a period, then don’t change it.
The economics of retention, and two numbers to stop quoting
In 1990, the study behind the modern retention argument reported that keeping 5% more customers could nearly double profits.[8] That summary comes from its authors’ own firm. It measured defection rates inside specific service industries. It wasn’t a universal law.
Then the retelling began. Each version travelled further from the original, and none added new data.
- More than 25% profit gain from a 5-point retention increase, financial services only, in a 2001 follow-up.[14]
- As much as 95% is how that same 1990 research was being restated by 2006.[15]
- 2014 is when the “25% to 95%” range first appeared, in a magazine article citing no study.[16]
- Five to 25 times costlier to win a customer than keep one, asserted flatly in that same 2014 article.[16]
- 2005 is when an audit traced the “five times cheaper” claim to an unpublished late-1980s consultancy figure.[17]
So what’s worth quoting instead? Numbers somebody actually measured.
- $2.00 in sales and marketing is what software companies spent to win $1.00 of new-customer recurring revenue.[18]
- $1.00 is what those same companies spent to earn a dollar of expansion revenue from existing customers.[18]
- 40% of all net new recurring revenue came from expansion at the median company in 2025.[12]
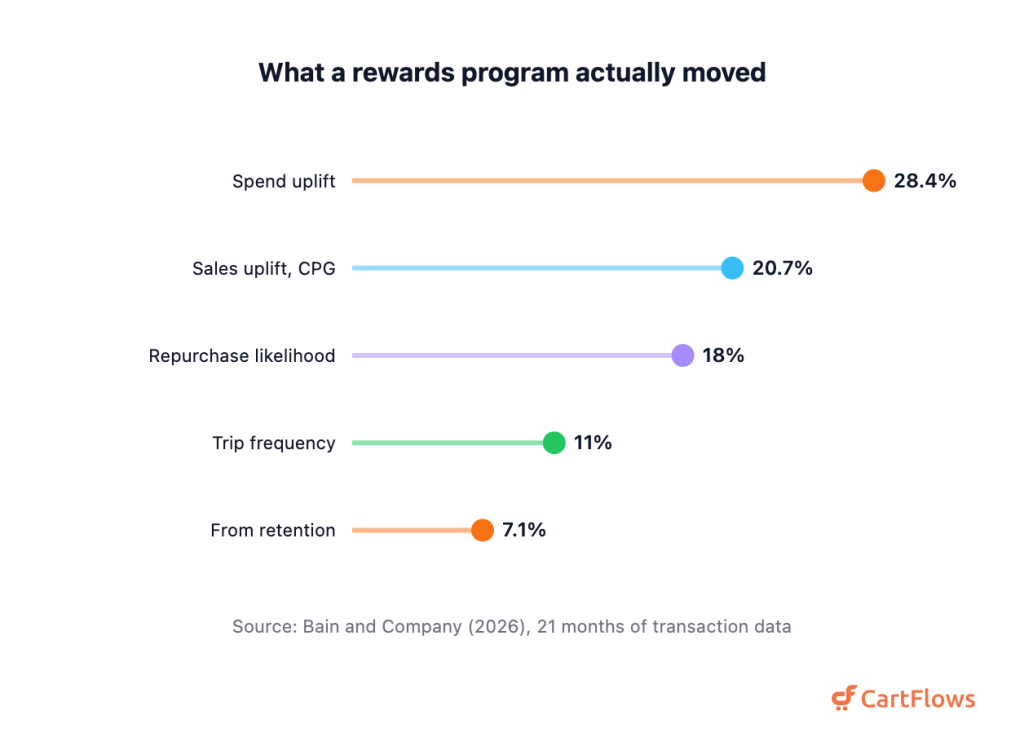
- 18% more likely to buy again within two quarters were first-time buyers who earned a purchase reward.[19]
- 28.4% more is what those rewarded first-time buyers went on to spend over the period.[19]
- 7.2 times the cost of the reward came back as value across 21 months of transactions.[19]
- 20.7% total CPG sales uplift over 12 months came from the rewards program studied.[19]
- 7.1% is how much rewards grew a brand’s customer base through retention and reactivation.[19]
- 11% higher shopping frequency is what the rewarded group showed against the control.[19]
- $3 trillion of global sales is put at risk each year by poor customer experiences.[20]
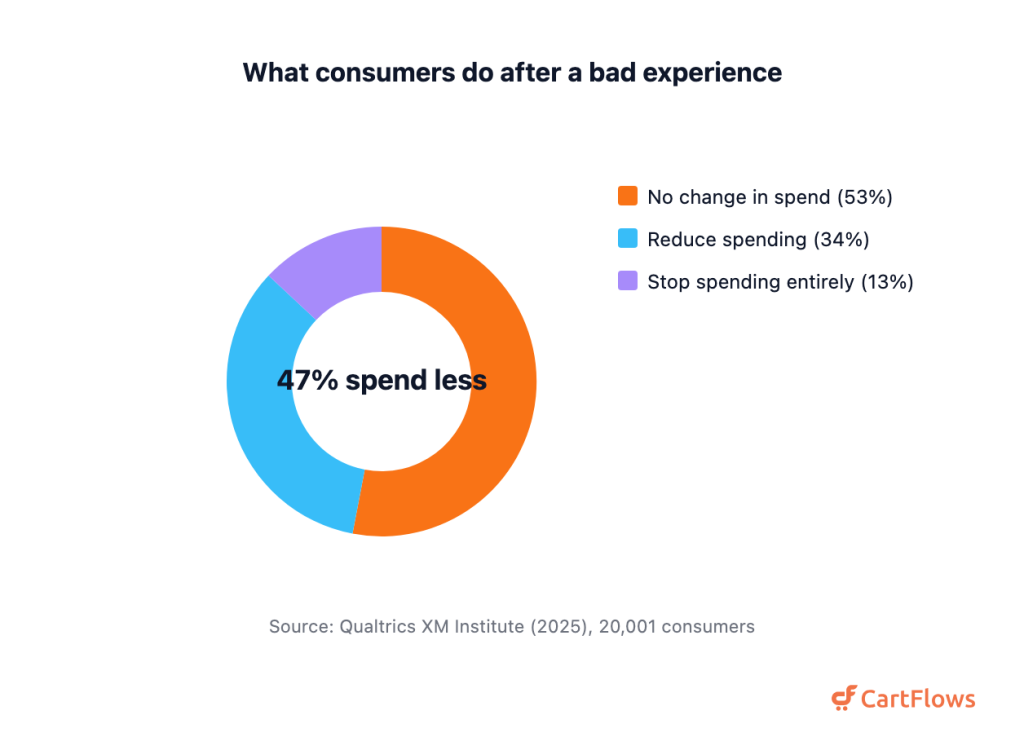
- 34% of consumers cut their spending after a bad experience, and 13% stop buying altogether.[20]
- 15% of recurring revenue went to selling in 2026, against 9% on support and success teams.[21]
Call it 2x, not 5x to 25x. For the acquisition side of that math, see our sales funnel statistics.
Customer retention rate by industry
Measured across 11 B2B industries in 2026, average customer retention ran from 89% in energy and utilities down to 44% in wholesale.[1] That’s a 45-point spread. One cross-industry average won’t help you much.
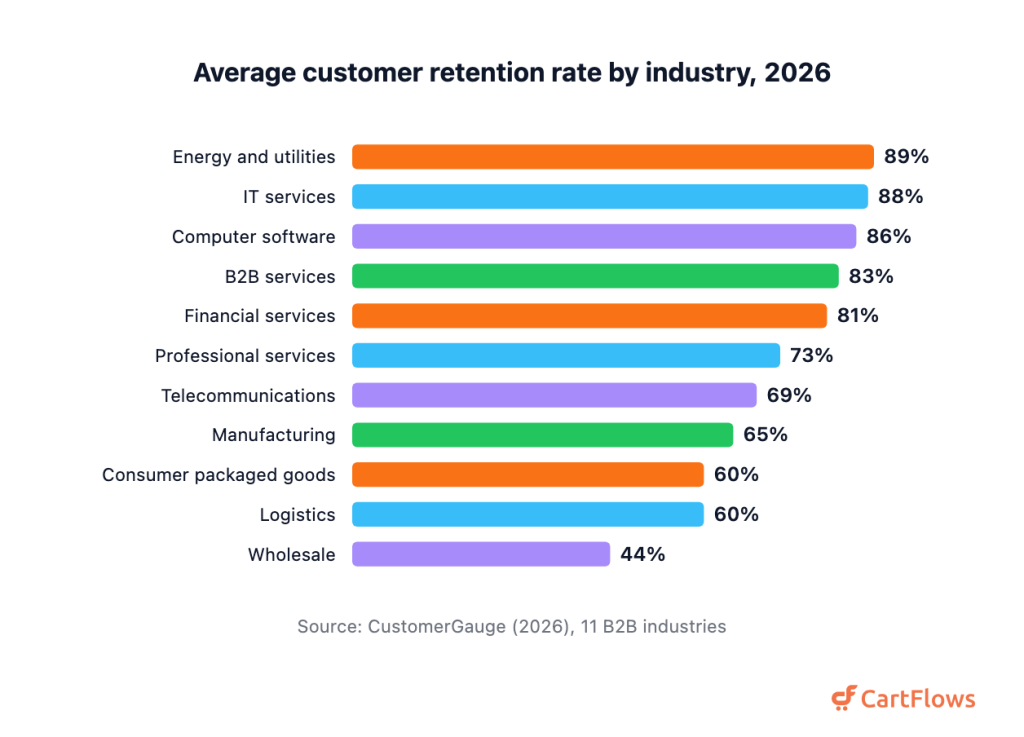
- 89% in energy and utilities, the highest of the 11 industries measured.[1]
- 88% in IT services, second highest of the group.[1]
- 86% in computer software, third on the list.[1]
- 83% in B2B services, just above financial services.[1]
- 81% in financial services in the same 2026 measurement.[1]
- 73% in professional services, just above the overall average.[1]
- 69% in telecommunications, below the cross-industry average.[1]
- 65% in manufacturing, well under that average.[1]
- 60% in consumer packaged goods, tied with logistics.[1]
- 60% in logistics, tied with consumer packaged goods.[1]
- 44% in wholesale, the lowest of the group by a wide margin.[1]
Now the provenance problem. The industry table circulating on most 2026 statistics pages isn’t new data, and it isn’t measured behavior either. It’s a self-reported survey from late 2017, and it still claims automotive retains 83%.
- 2017 is when that recycled survey was fielded, across 468 self-reporting companies with a 77% average.[22]
- 51.1% was US automotive brand loyalty through June 2025, from vehicle registrations and down 1.4 points.[23]
- 68.1% multi-brand loyalty put General Motors top in 2025, with Ford leading single-brand loyalty at 58.9%.[23]
- 51% of the highest-lifetime-value auto insurance customers would definitely renew, against 53% medium-value and 54% low-value.[24]
- 0.89% quarterly postpaid phone churn came from the best-performing US carrier in Q3 2025, alongside 2.77% prepaid.[25]
- 30% retention is roughly where ecommerce sits, the lowest of any major sector measured.[9]
- 82% median net revenue retention for business software, measured from live billing data in 2025.[26]
- 49% for consumer software and 48% for AI-native products, in that same billing dataset.[26]
Consumer software retains at roughly half the business rate. Our ecommerce statistics add storefront context.
Why customers leave
In 2025, 63% of consumers said they were willing to switch to a competitor after a single bad experience.[3] That’s a jump of 9 percentage points in one year. Tolerance is falling fast, and it isn’t bouncing back.
Asked what breaks their loyalty, consumers ranked five causes above the rest in 2025.
- 54% named falling product quality, the top loyalty breaker of the year.[27]
- 49% named price increases, second on the same list.[27]
- 47% named poor customer service, third on the 2025 list.[27]
- 34% named careless handling of their personal data.[27]
- 32% named misleading advertising, fifth on the list.[27]
The exit rarely needs many strikes. And you mostly won’t hear about it first.
- 70% of consumers will abandon a brand after two negative experiences, and 24% after just one.[28]
- 52% of consumers say they have already stopped buying from a brand after a bad experience.[29]
- 29% blame a brand exit on poor customer service rather than on the product itself.[29]
- 28% of consumers said they switched brands in 2025 simply because they got bored.[27]
- 29% counted as genuinely loyal in 2025, down from 34% and the steepest drop in five years.[27]
- 30% of consumers who have a bad experience tell nobody about it and simply switch.[30]
- Fewer than one in three consumers now gives a company feedback after an experience, an all-time low.[20]
- 46% of customers said back in 2022 that they rarely or never complain, up from 44%.[31]
- 72% of users left a company’s website after a poor experience in 2025, and 84% struggle to find help.[32]
- 5% intend to stop buying when a problem is solved on first contact, rising to 19% unresolved.[33]
- 74% find repeating their story to a second agent frustrating, and 81% expect the conversation to continue.[34]
Repeat purchase and ecommerce retention
A shopper who has bought once from an online store has a 27% chance of buying again.[4] After a second purchase it’s 49%, and after a third 62%. The second order isn’t just another order. It’s the one that changes the odds.
- 21% of an online store’s customer base is repeat customers, and they drive 44% of revenue.[5]
- 8% of an online store’s customers account for 41% of its total revenue.[4]
- 35% of revenue comes from the top 5% of an online store’s customers.[4]
- 2 times the per-order spend of everyone else is what the top-spending 10% put through.[4]
- 2.5 times more per order is the multiple for the very top 1% of customers.[4]
- 2.9% was the 2025 conversion rate for returning visitors, against 1.7% for first-time visitors.[35]
- 4.1% is how far returning-visitor conversion slipped in a year, against 7.9% for new visitors.[35]
- 52.8% of all website traffic now comes from returning visitors rather than new arrivals.[36]
Returning traffic now carries the store. Our ecommerce conversion rate statistics cover the conversion side of it.
- 9% more is what a single site visit cost to acquire in 2025, up 30% over three years.[36]
- $32.74 was median ecommerce cost per acquisition in 2025, an 8.64% rise in a year.[37]
- $14.19 was median Meta ad CPM after a 20.03% climb, while paid conversion rates fell 6.21%.[37]
- 10.8% was the average discount offered to first-time buyers in early 2026, up from 9.8%.[38]
- 11.7% was the average discount offered to repeat buyers, down from 12.1% a year earlier.[38]
Paying more for worse traffic.
Checkout is where that spend lands or leaks, and our cart and checkout abandonment statistics cover that side of it. Returns take the rest, and those numbers aren’t small.
- 19.3% of online sales were returned in 2025, part of $849.9 billion in US retail returns.[39]
- 82% of online shoppers say free returns matter, and 71% avoid a retailer after a bad one.[39]
- 90% of shoppers read the return policy before buying, and 76% will not buy there again afterwards.[40]
- 73% of purchases are influenced by estimated delivery dates, and 40% will not order without one.[40]
- 65.2% of online merchants now charge a returns fee, averaging $9.04 per return.[41]
Subscription retention and the churn nobody chooses
Among subscription customers on a monthly reorder cycle, 86.6% complete a first reorder and 57.6% reach a second.[42] The drop isn’t gradual. It’s a cliff in the first quarter.
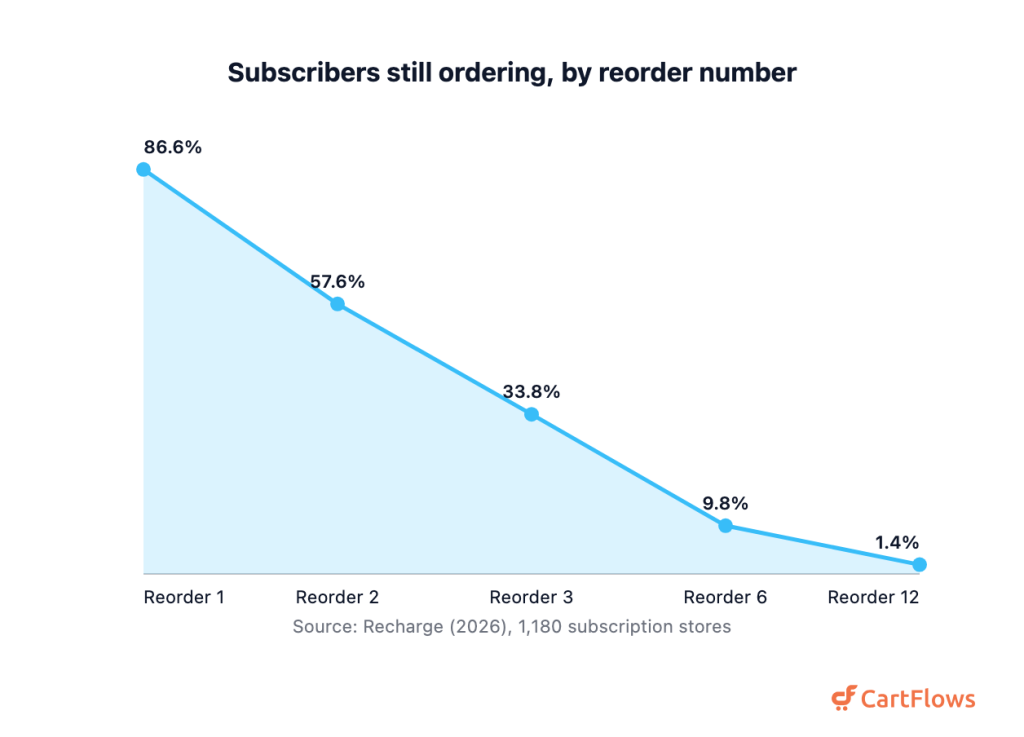
- 33.8% of monthly subscribers reach a third reorder, 9.8% a sixth, and only 1.4% a twelfth.[42]
- 99.3% first-reorder rate in coffee and tea makes it the strongest category measured.[42]
- 97.5% in beauty, 96.2% in pet, 92.9% in health and wellness, and 86.6% in supplements.[42]
- 3 times as many orders is what subscribers place against one-time shoppers at the same brands.[43]
- 3.22% median annual subscription churn in software, the lowest of the verticals measured.[2]
- 4.99% in education, with travel at 3.91% and ecommerce sitting at 4.25%.[2]
- A third of all subscription churn is involuntary, caused by failed payments rather than customer decisions.[2]
- 1.30% of subscribers goes to failed payments at $10 to $25 a month, seven times the 0.18% above $250.[2]
- 85% of revenue was retained by AI-native plans above $250, against 61% at $50 to $249 and 32% below.[26]
- 57% of failed subscription payments were recovered by automated retries, and rescued subscriptions ran another seven months.[44]
- Three in four subscribers who pause instead of cancelling come back, and pause use grew 337%.[45]
- Nearly one in four new subscription sign-ups is a former subscriber coming back.[45]
Cheap subscribers don’t stay.
Failed payments are the churn nobody chose, and they’re the cheapest kind to fix. Running subscriptions on WordPress? Our WooCommerce statistics add store-level context.
Loyalty program statistics
In 2026, 85% of loyalty program members said a program makes them more likely to keep buying from a brand.[6] That’s self-reported, so read it next to what members actually do.
- 73% of those members also said they spend more because of the program.[6]
- 8 programs is what the average US loyalty member joins, while actively using only about five.[46]
- 72% of members said programs make them more likely to spend, but only 56% said spending rose.[46]
- 89% of major retailers ran a loyalty program by early 2026, up from 79% a year earlier.[47]
What members want isn’t complicated, or expensive.
- 55% ranked better prices first among the things they want for their loyalty.[27]
- 53% ranked great customer service second, points or cashback third at 50%, free returns fourth at 40%.[27]
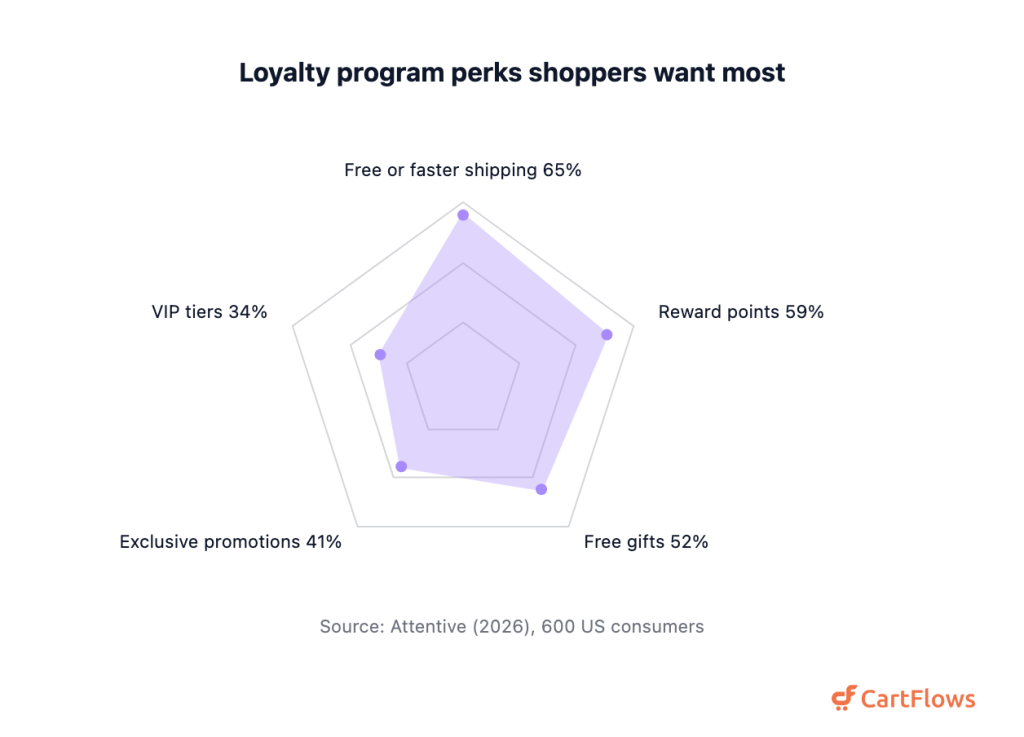
- 65% of US shoppers picked free or faster shipping as the perk they want most.[48]
- 59% chose reward points, 52% free gifts, 41% exclusive promotions, and 34% VIP tiers.[48]
- 56% higher repeat purchase rate is what reward redeemers show, and they come back 23% sooner.[49]
- $17.38 billion was the global loyalty management market in 2026, forecast to reach $51.65 billion by 2034.[50]
- $5.49 billion in 2022 is the base year behind the “$5.5 billion loyalty market” line still quoted today.[51]
Redemption is the moment that matters. Everything before it is a promise, and a program nobody redeems from isn’t really a retention program.
The channels that bring customers back
Automated email flows earned click rates of 5.58% in 2026, against 1.69% for scheduled campaigns.[52] Triggered beats broadcast, and it isn’t close.
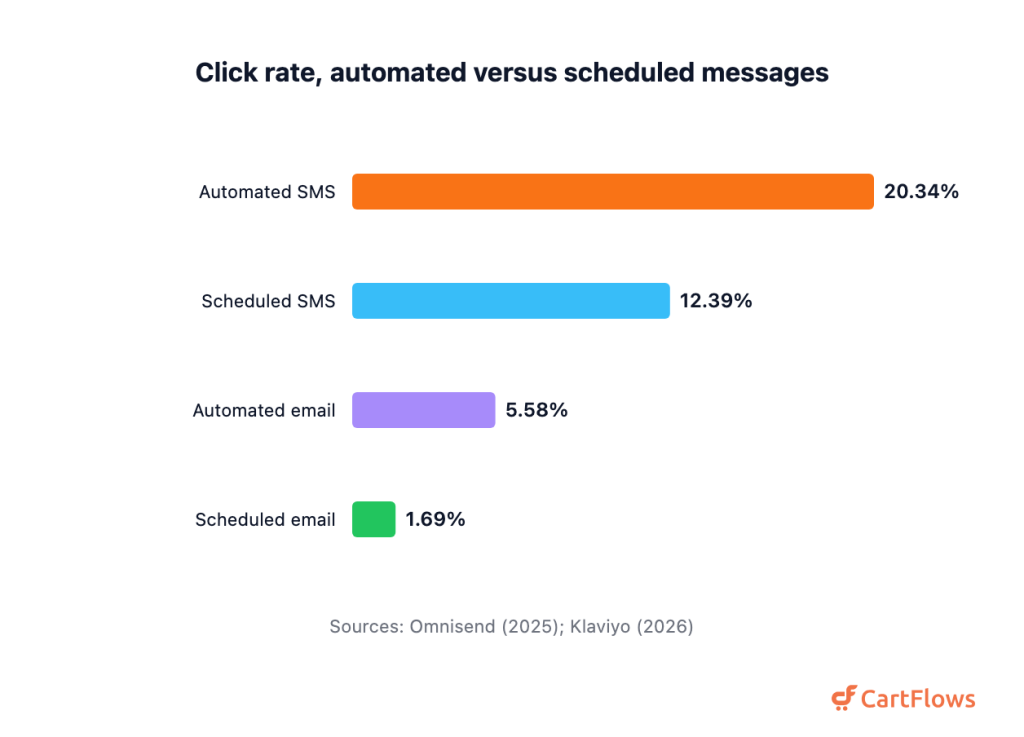
- 13 times the order rate and nearly 18 times the revenue per recipient came from automated flows.[52]
- 7.6% of all SMS sends are automated, and they drive 45.2% of SMS revenue.[53]
- $3.41 per email is what automated emails returned in 2025, at a 1.49% conversion rate.[54]
- 15.5 cents per email is what scheduled campaigns returned, at a 0.08% conversion rate.[54]
- 20.34% click-through rate and 75 cents per message is what automated texts achieved in 2025.[55]
- 12.39% and 15 cents per message is all that scheduled SMS campaigns managed.[55]
- 51 cents per email at a 0.54% conversion rate makes win-back the weakest automation.[54]
- 93% of shoppers say personalization makes them likely to keep buying from a brand.[56]
- 2 times as likely to buy again are shoppers subscribed to two or three channels.[56]
- 17.5% growth in ecommerce revenue from texting in early 2026, roughly double the 9% elsewhere and above 20% among repeat shoppers.[38]
Catching the order before it lapses beats reviving the customer months later. That’s the case for cart abandonment recovery over reactivation.
Retention versus acquisition: where the money goes
Loyalty and retention now takes under 15% of total media spend, a 29% fall since 2024.[7] Retention is where everyone says the value sits. It’s not where the budget goes.
- 62.6% of total media spend goes to awareness and conversion together in 2026.[7]
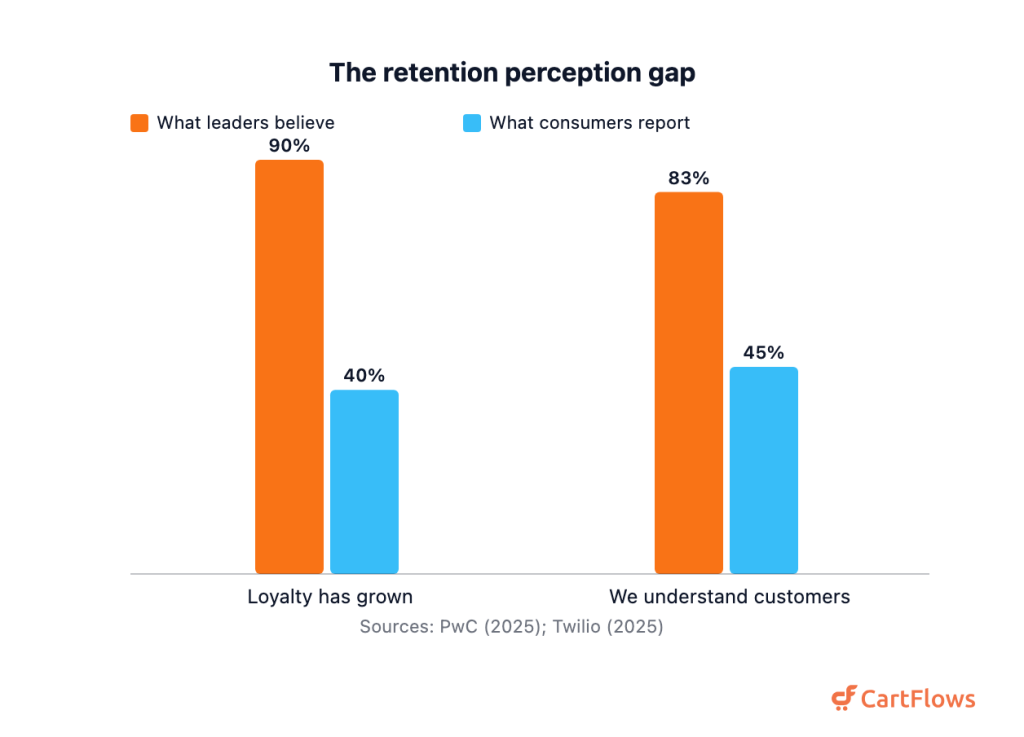
- 90% of executives believe customer loyalty has grown, while only 40% of consumers agree.[29]
- 45% of consumers feel understood by the brands they buy from, down from 46%.[57]
- 83% of business leaders believe they understand their customers deeply, the other side of that gap.[57]
- 59% of loyalty practitioners put customer lifetime value first for 2026, up from 36% in 2021.[58]
- 44% named cutting churn as a top goal for 2026, up from 27% in 2021.[58]
- 5.3 times their investment is the average return where loyalty programs measure results, and 92.7% report positive.[59]
- 74% of marketers named retaining customers through loyalty a goal in 2023, against 73% naming acquisition.[60]
The stated split is even. The spending split isn’t, and that gap is the story of this section.
Sources and methodology
Every number here was read on the page of the organization that produced it, never on a listicle repeating it.
We chased each aggregator figure back to its original study and dropped 38 that couldn’t be traced to a primary or were contradicted by one. The much-quoted 75.5% “all-industry average” is one of them, with no named survey anywhere in its chain.
Two caveats we’d rather flag than bury. Gartner’s own release blocks automated access, so the media-spend figures link the trade-press report where we could actually read them. The roughly 30% ecommerce retention rate was measured by Decile and published by Shopify.
One limit worth naming: Recurly labels its figures median annual churn, which implies much higher retention than the gross revenue retention ChartMogul and Benchmarkit measure. That’s different populations and different metrics. So we use Recurly for its relative cuts, by vertical and by price band, not as an absolute benchmark.
Last updated: August 10, 2026.
Final Thoughts
Retention data has a credibility problem, and it isn’t caused by a shortage of numbers. It’s caused by numbers that get copied faster than they get checked. Building this page, the pattern that kept surfacing wasn’t disagreement between studies. It was studies that didn’t exist.
So treat any retention statistic the way you’d treat a supplier claim. Ask who measured it, when, and on what sample. If the trail ends at a listicle, the number isn’t evidence. The reassuring part? Properly measured figures tell a clear enough story on their own. Billing systems and registration records don’t need help.
Frequently Asked Questions
References
2. Recurly
3. Zendesk
4. Smile.io
5. Gorgias
6. Bond
7. Marketing Dive, reporting the Gartner 2026 CMO Spend Survey
8. Bain
9. Shopify
10. CustomerGauge
11. SaaS Capital
12. Benchmarkit
13. CustomerGauge
14. Bain
15. Bain
16. HBR
17. Ipsos
18. Benchmarkit
19. Bain
21. SaaS Capital
22. CustomerGauge
24. J.D. Power
25. T-Mobile
26. ChartMogul
27. SAP Emarsys
28. Emplifi
29. PwC
30. Qualtrics
31. Coveo
32. Coveo
33. SQM Group
34. Zendesk
35. Contentsquare
36. Contentsquare
37. Triple Whale
38. Klaviyo
40. Narvar
41. Loop Returns
42. Recharge
43. Recharge
44. Stripe
45. Recurly
46. Deloitte
47. Modern Retail
48. Attentive
49. Smile.io
52. Klaviyo
53. Klaviyo
54. Omnisend
55. Omnisend
56. Attentive
57. Twilio
58. Open Loyalty
59. Antavo
60. Attentive