Cross-selling accounts for 21% of total company revenue on average, measured across a survey of 1,400+ sales professionals.[1] That’s the most defensible number on this topic. Below it sit 115+ verified statistics: attach rates, order value, email and SMS benchmarks, AI recommendations, B2B expansion revenue and industry data.
Every figure here was traced to the organization that measured it, and 48 claims that couldn’t be traced were dropped. Several of those are the headline numbers on competing pages. The “Amazon gets 35% of revenue from recommendations” line is one of them.
Cross-selling headline numbers
- Cross-selling generates 21% of total company revenue on average, across 1,400+ sales professionals surveyed.[1]
- Customer expansion supplied 52% of all new revenue at B2B sales organizations in 2025, across 655,000 opportunities analyzed.[2]
- Automated email flows earned 41% of all ecommerce email revenue from just 5.3% of sends.[3]
- Average order value rose 68.1% for sellers running a one-click post-purchase upsell, measured across $7B+ in processed sales.[4]
- Shoppers who clicked a product recommendation generated 26% of ecommerce revenue from just 7% of visits.[5]
- 69% of early AI shopping assistant adopters quit after a single irrelevant suggestion, from a survey of 2,000 US and UK adults.[6]
- 96% of consumers say personalized messages make them likelier to buy, while 81% ignore irrelevant ones.[7]
- Expansion ARR reached 40% of all new ARR at the 2024 B2B SaaS median, up from 25% in 2022.[8]
- 10% to 35% of a firm’s cross-buying customers are unprofitable, and they drive 39% to 88% of its total customer loss.[9]
- The “Amazon gets 35% of revenue from recommendations” line is a 2013 McKinsey estimate about purchases that Amazon has never confirmed.[10]
- Cross-selling headline numbers
- What cross-selling is, and how to measure it
- How much revenue cross-selling actually drives
- Attach rate and average order value
- Where the offer goes: on-site placement
- Email and SMS cross-sell benchmarks
- Product recommendations and AI
- What shoppers say about being offered more
- B2B and SaaS expansion revenue
- Cross-selling by industry
- When cross-selling backfires
- Putting these numbers to work
- Sources and Methodology
- Final Thoughts
- Frequently Asked Questions
- References
What cross-selling is, and how to measure it
Cross-selling means offering a customer an additional, complementary product alongside what they’re already buying. Upselling swaps them into a pricier version of the same item instead, and the two work best in sequence rather than as substitutes. If you’re deciding which to run first, we’ve mapped the difference between upselling and cross-selling in detail.
The metric that tracks it is your cross-sell rate, sometimes called attach rate. Divide the orders containing at least one added product by your total orders, then multiply by 100.
So a store with 2,000 orders last month, 240 of which included an add-on, ran a cross-sell rate of 12%. Track it per offer and per placement. A checkout order bump and a post-purchase upsell don’t perform alike.
How much revenue cross-selling actually drives
On average, cross-selling delivered 21% of total company revenue in 2024, measured across a survey of more than 1,400 sales professionals.[1] Trying it is close to universal, with 87% of salespeople saying they do. What varies is the payoff, and most sellers report a contribution that doesn’t clear 30%.
- 21% of total company revenue comes from cross-selling on average. That average covers 1,400+ sales professionals surveyed across North America, Europe and Asia.[1]
- 87% of salespeople say they attempt a cross-sell at some point in the sales process.[1]
- Among sales professionals surveyed in 2022, 79% cross-sold and 27% down-sold.[11]
- Upselling was the more common tactic in that survey, used by 88% of sales professionals.[11]
- 74% of cross-sellers reported that cross-selling generates between 1% and 30% of company revenue.[11]
- The equivalent figure for upsellers sat at 72%, again for a 1% to 30% revenue contribution.[11]
- Growth from existing customers ranked as a 2025 priority for 73% of chief sales officers, across 243 sales leaders surveyed.[12]
- Account retention and growth landed in the top three priorities for 57% of those sales leaders.[12]
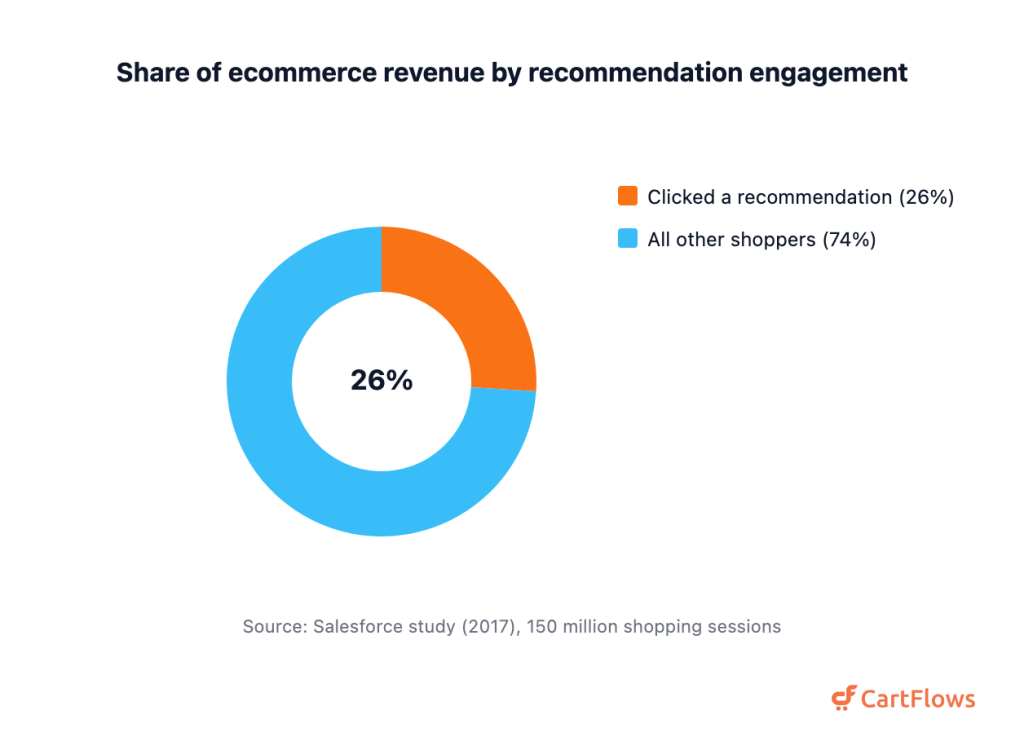
- Shoppers who clicked a product recommendation generated 26% of ecommerce revenue, across 150 million shoppers and 250 million visits analyzed in 2017.[5]
- Those same recommendation-clickers drove 24% of all ecommerce orders.[5]
- Only 7% of site visits included a click on a product recommendation.[5]
- Customer expansion supplied 52% of all new revenue at B2B sales organizations in 2025, across 655,000 opportunities analyzed.[2]
Look at the asymmetry in those recommendation figures. A click happened on 7% of visits, and it carried a quarter of the revenue.
If the vocabulary matters to you, we’ve written separately on the difference between upselling and cross-selling. Most pages blend the two, and blended numbers can’t tell you which tactic paid.
Attach rate and average order value
Brands running two post-purchase upsell offers each earned nearly $93,000 in incremental revenue in 2025, across a set of more than 40,000 brands.[13] Single-merchant attach rates run higher and narrower, with one store seeing 36% to 37% of orders include an add-on. That gap between one platform and one store is why attach-rate benchmarks don’t travel well.
- 36% to 37% of orders at a single merchant included a cross-sell add-on across a 30-day window.[14]
- That same merchant recorded an 18.01% increase in average order value.[14]
- Add-on products drove 15% of that merchant’s sales directly.[14]
- Sales influenced by the recommendation widget reached 37%, a wider measure than direct attribution.[14]
- Sellers running a one-click post-purchase upsell saw average order value climb 68.1%, across more than $7B in processed sales.[4]
- Upsell transactions made up 58% of all revenue processed through that platform.[4]
- A single $17 order bump attached to a $47 core product took a 43% take rate.[4]
- Brands running two post-purchase upsell offers earned nearly $93,000 each in incremental revenue, across a set of 40,000+ brands.[13]
- Post-purchase upsells drove more than $100M in revenue platform-wide on that app.[13]
- Visits with a recommendation click carried a 10% higher average order value than visits without one.[5]
- 37% of shoppers who clicked a recommendation on a first visit came back, against 19% of those who didn’t.[5]
- AI product recommendations on a jewelry retailer’s product page lifted conversion 26% and revenue 35% in an A/B test.[15]
- The same recommendation engine placed in email lifted conversion 6.5% and revenue 16%.[15]
- In abandoned-cart email, those recommendations raised click rate 35% and conversion 32%.[15]
- 78% of US shoppers bought at least one additional item after a successful on-site search, averaging three extra items.[16]
Read those attach rates carefully, because three different metrics are sitting near each other. A 36% attach rate at one brand isn’t an industry benchmark. A 43% take rate came from one price pairing. And 58% of platform revenue counts every upsell transaction across thousands of sellers.
Measure your own attach rate before you trust anyone else’s.
What does travel is placement. Order bumps at checkout and one-click post-purchase offers work because they remove a decision, and that’s a different thing from pushing harder.
Where the offer goes: on-site placement
Cart cross-sells on 52% of desktop ecommerce sites ignored what was in the cart, suggesting only what other customers bought.[17] That came from usability testing published in 2021. Placement decides whether an offer helps or annoys, and checkout isn’t a quiet place to put one.
- 52% of desktop ecommerce sites showed cart cross-sells that ignored cart contents, suggesting only what other customers bought.[17]
- Cross-sell suggestions on 68% of desktop sites lacked enough list-item detail, such as a thumbnail, price or rating.[18]
- Klaviyo’s own cross-sell flow template waits 14 days after fulfillment before it sends.[19]
- Extra costs like shipping, tax and fees were cited by 40% of cart abandoners. That’s the friction any add-on offer competes with.[20]
- First-time buyers generated 48% of flow-driven email revenue, against 16% for campaign email.[3]
- Campaigns absorb 94.7% of ecommerce email send volume, leaving automated flows a thin slice of sends.[3]
So most cart cross-sells fail on relevance before they fail on design. Half of desktop sites suggest something the cart doesn’t imply, and two thirds don’t show enough detail to judge it.
Timing is the other lever, and it’s later by default than most stores assume. Our documentation covers product recommendations in the cart if you want the mechanics.
Email and SMS cross-sell benchmarks
Automated email flows produced 41% of all ecommerce email revenue in the 2026 benchmark data while accounting for just 5.3% of sends.[3] That’s the cross-sell asymmetry in one line, because the triggered message beats the broadcast. Revenue per recipient ran 18x higher on flows.
- Emails using AI product recommendations averaged a 3.75% click rate, against 1.69% for campaign email overall.[3]
- Among top performers, that click rate with AI recommendations reached 8.79%.[3]
- Automated flows earned 41% of total ecommerce email revenue from just 5.3% of sends.[3]
- Revenue per recipient ran 18x higher on automated flows than on one-off campaigns.[3]
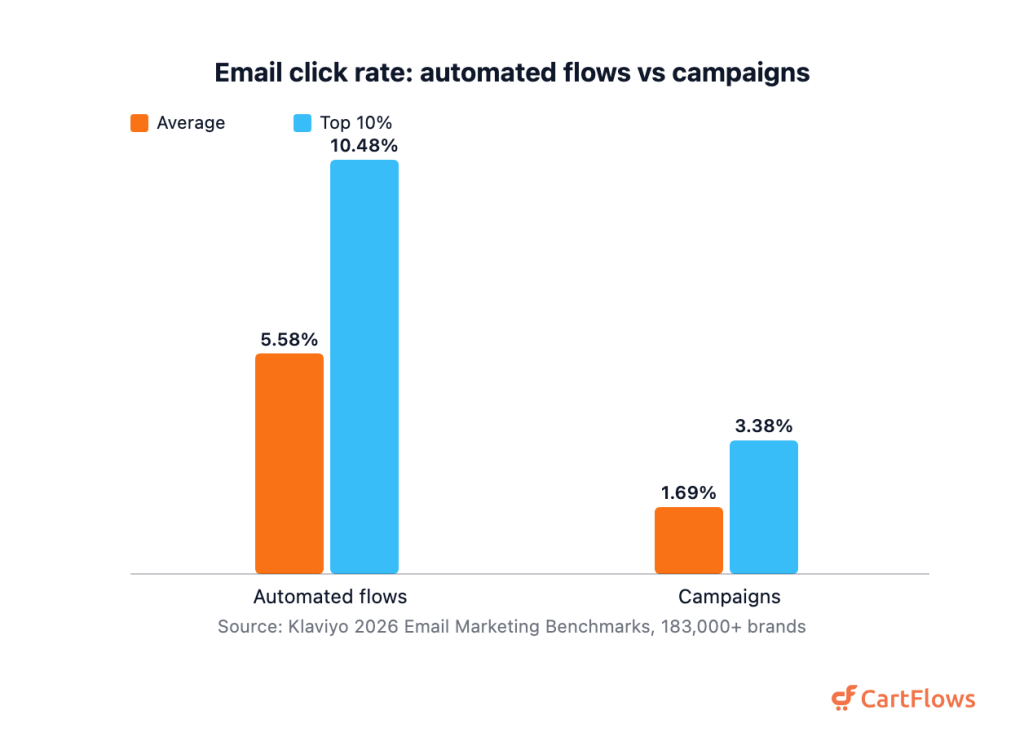
- Flow click rate stood at 5.58% against 1.69% for campaigns.[3]
- The top 10% of flows clicked at 10.48%, while the top 10% of campaigns managed 3.38%.[3]
- Average revenue per recipient reached $2.54 on flows and $0.32 on campaigns.[3]
- Order-confirmation emails opened at 53.99%, the highest rate of any automation type.[21]
- Click-to-conversion on order-confirmation emails hit 14.25%.[21]
- Each order-confirmation email produced $1.60 in revenue.[21]
- Back-in-stock emails opened at 59.19% and converted at 5.34%.[22]
- Campaign email across all senders averaged a 26.6% open rate and a 1.22% click rate.[22]
- Cart, welcome and browse-abandonment flows together drove 87% of all automated-email orders.[22]
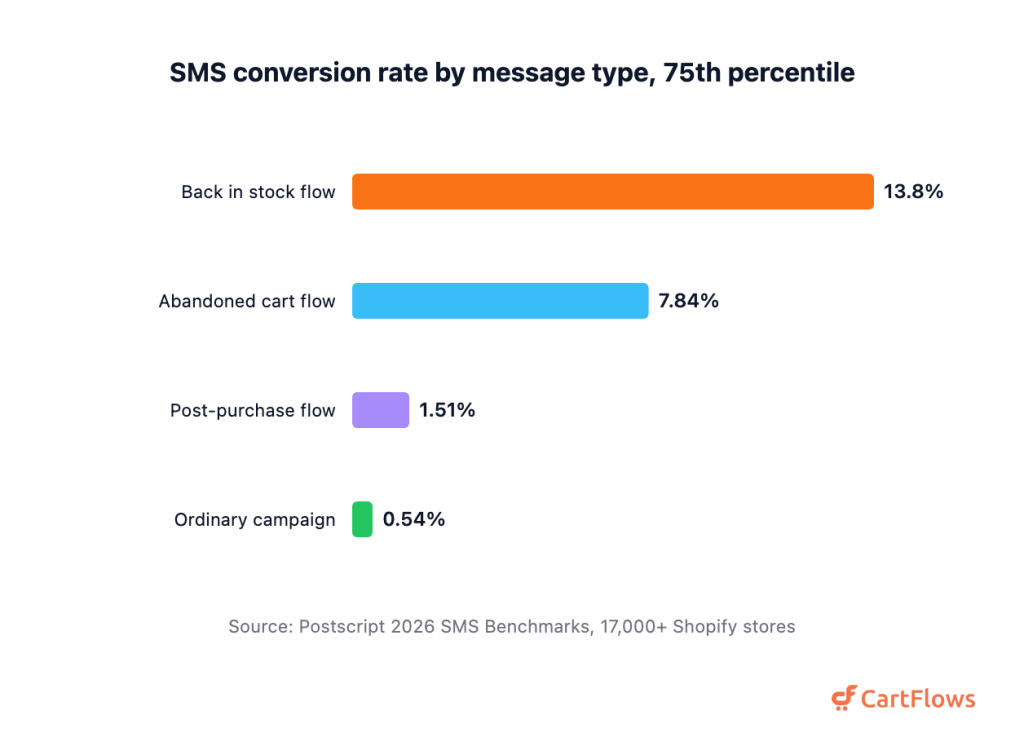
- Post-purchase SMS flows converted at 0.45% to 1.51% between the 25th and 75th percentile, across 17,000+ Shopify stores.[23]
- Click-through on those post-purchase SMS flows ranged from 4.68% to 14.26%.[23]
- Earnings per message on post-purchase SMS ran $0.34 to $1.53.[23]
- Abandoned-cart SMS flows converted at 3.97% to 7.84%, well above post-purchase flows.[23]
- The strongest SMS flow was back-in-stock, converting at 7.18% to 13.80%.[23]
- Ordinary SMS campaigns converted at just 0.12% to 0.54%, an order of magnitude below flows.[23]
- SMS automations clicked at 20.34% and converted at 0.78%. Campaign SMS managed 12.39% and 0.12%.[24]
- Abandoned-cart email flows opened at 50.5% and clicked at 6.25%. They converted at 3.33% and earned $3.65 per recipient.[25]
- Top-decile abandoned-cart flows converted at 7.69% and earned $28.89 per recipient.[25]
The message that already has the shopper’s attention is the one worth using. Order confirmations open above half, and nothing else in the automation stack comes close.
Campaigns still take 94.7% of send volume.
That’s the gap most stores haven’t closed.
Product recommendations and AI
Two thirds of US and UK consumers, 66%, had tried or would try an AI shopping assistant.[6] That survey covered 2,000 adults and was fielded in late 2025. Tolerance for a bad suggestion isn’t wide. Among early adopters, 69% walked away after a single irrelevant recommendation.
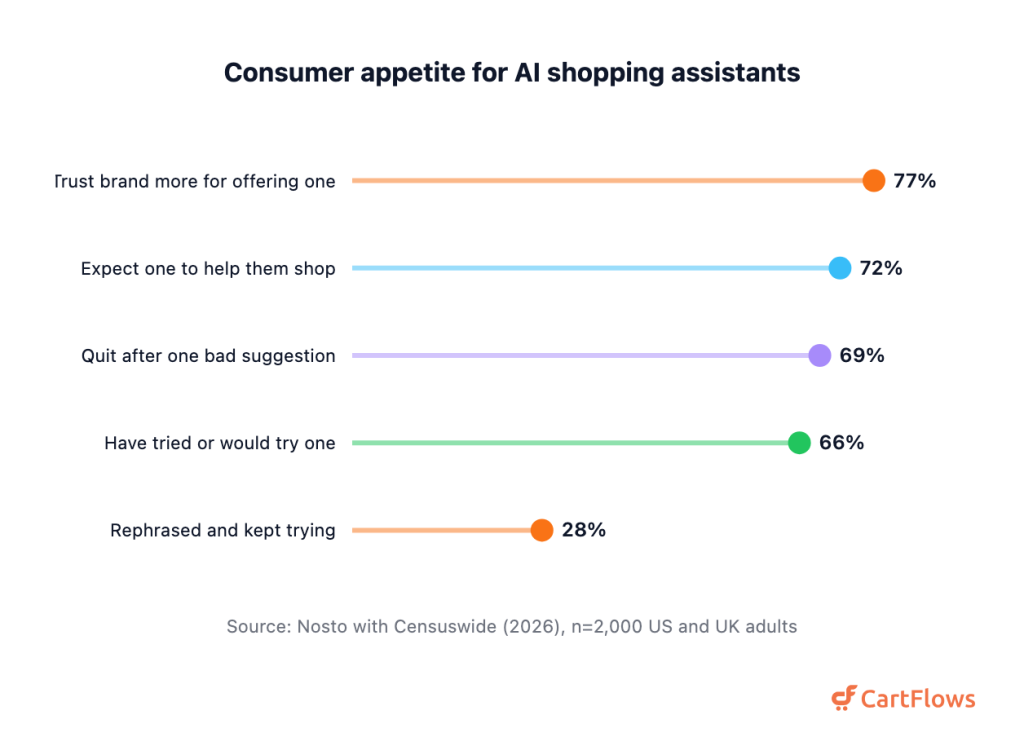
- Among 2,000 US and UK adults surveyed, 66% had tried or would try an AI shopping assistant.[6]
- 69% of early adopters abandoned an AI shopping assistant after one irrelevant suggestion.[6]
- Only 28% rephrased their request and kept trying instead.[6]
- Help with online shopping is something 72% of consumers now expect from AI assistants.[6]
- Offering an AI assistant would raise trust in a brand for 77% of early adopters.[6]
- 40% of consumers said they were more likely to purchase with an AI assistant supporting them. That sample covered 4,000 US and UK shoppers.[26]
- 62% of shoppers reported being more likely to purchase with generative-AI guidance in 2025, rising to 68% among millennials.[27]
- Purchase confidence increased for 60.8% of shoppers using AI shopping tools.[28]
- Global online holiday sales worth $262B in 2025, or 20% of the total, were influenced by AI and AI agents.[29]
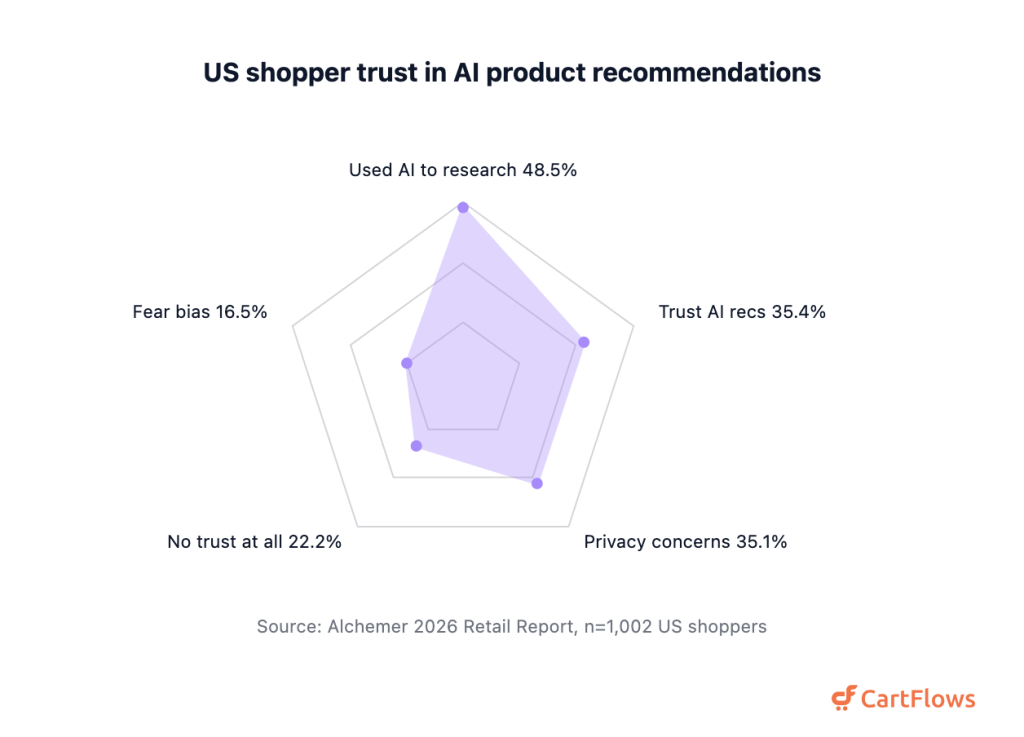
- Nearly half of US shoppers, 48.5%, had used an AI tool to research a purchase in the past year.[30]
- B2B ecommerce sellers using AI to personalize recommendations rose to 32% from 15% a year earlier.[31]
- AI capability ranked as the top priority for 83% of B2B sellers choosing a site-search tool.[31]
- Positive ROI from AI in customer personalization was reported by 48% of US retail AI leaders, from a sample of 56.[32]
Appetite and tolerance move in opposite directions here. Consumers want the help. But they leave at the first bad suggestion.
What shoppers say about being offered more
Irrelevant marketing messages get ignored by 81% of consumers, in a 2025 survey of 3,300 shoppers across three countries.[7] The flip side is just as strong, since 96% said a personalized message makes them likelier to buy. What shoppers are rating isn’t frequency, it’s relevance.
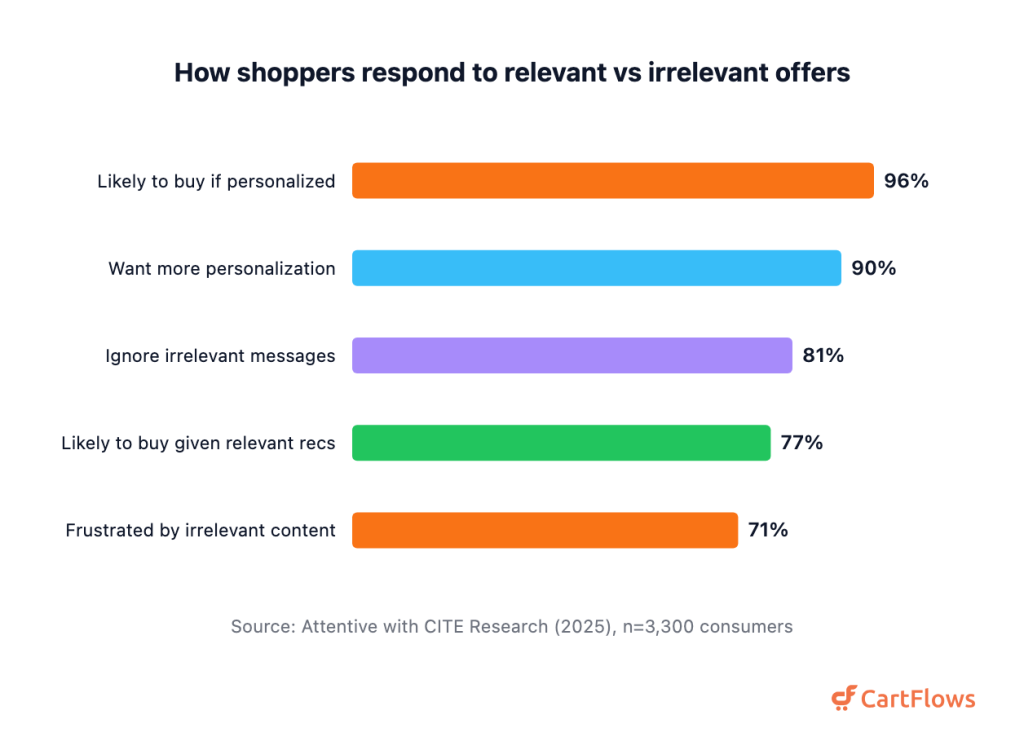
- 81% of consumers ignore marketing messages they find irrelevant, across a sample of 3,300 shoppers in the US, UK and Australia.[7]
- Active frustration with irrelevant content was reported by 71% of those consumers.[7]
- 96% said personalized messages make them likelier to purchase.[7]
- Relevant product recommendations would push 77% of consumers to buy from a brand, rising to 83% among millennials.[7]
- More personalized communication than they currently get is what 90% of consumers say they want.[7]
- Data sharing in exchange for personalization was acceptable to 58% of consumers, provided they trusted the brand.[27]
- Complete or mostly complete trust in AI product recommendations was reported by 35.4% of US shoppers.[30]
- No trust at all in AI product recommendations was expressed by 22.2%.[30]
- Asked head to head, 15.4% picked AI recommendations, against 36.1% for online reviews and 31.2% for personal recommendations.[30]
- Privacy concerns specifically about personalization features were cited by 35.1% of shoppers.[30]
- 16.5% worried that recommendations are biased toward what the retailer wants to sell.[30]
Shoppers aren’t asking for fewer messages. Instead they’re asking for messages that make sense given what they already bought.
But trust in the machine doing the suggesting isn’t there yet. Only 15.4% picked AI recommendations over reviews or friends when the three were put side by side.
B2B and SaaS expansion revenue
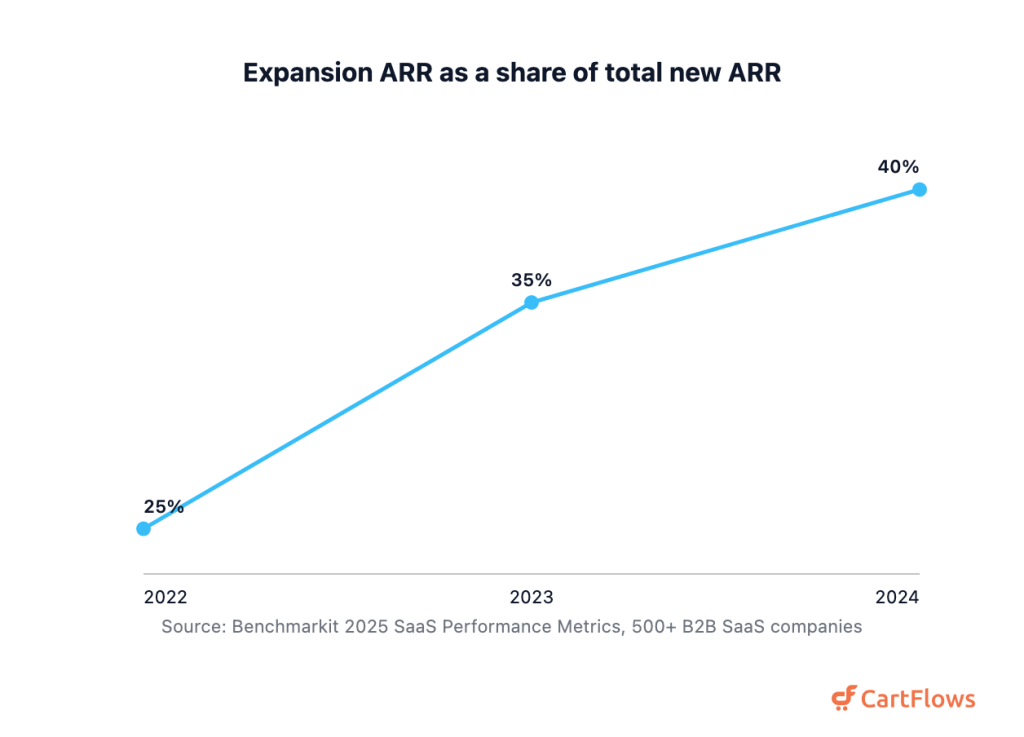
Median net revenue retention across private B2B SaaS companies fell to 101% in 2024, down from 105% in 2021.[8] Expansion still carries growth, with 40% of new ARR coming from existing customers at the median. And it’s a larger share the bigger the company gets.
- Median net revenue retention across private B2B SaaS companies stood at 101% in 2024, down from 105% in 2021.[8]
- Expansion ARR made up 40% of total new ARR at the 2024 median. That’s up five points year over year, from 35% in 2023 and 25% in 2022.[8]
- In the $50M to $100M ARR band, expansion supplied 58% of new ARR.[8]
- Above $100M ARR that share reached 67%, though from a sample of only six companies.[8]
- Median gross revenue retention slipped to 88% from 90% over the past three years.[8]
- Private SaaS companies in the $25K to $50K ACV band posted a median NRR of 102%. The top quartile reached 111% and the bottom quartile 97%.[33]
- Bootstrapped SaaS companies at $3M to $20M ARR recorded a median 103% NRR and 91% GRR. Their 90th percentile NRR reached 117.9%.[34]
- Above $50M ARR, 60% of new ARR came from existing customers, across 800+ survey respondents.[35]
- Blended customer acquisition cost ran $1.40 per dollar in 2024, against $2.00 for new customers only.[36]
- B2B sales win rates fell to 19% in 2025 from 29% a year earlier.[2]
Expansion is the default growth engine above $50M ARR. But below that line, new business still carries most of the load.
Watch the denominator, though.
A 67% expansion share sounds decisive until you notice it came from six companies.
Cross-selling by industry
High-performing financial institutions added 1.34 new products per digital banking user in 2024, roughly double the low performers.[37] Cross-sell payoffs aren’t uniform across sectors. Insurance clients holding five or more policies stayed 84.7% of the time over five years, against 77.1% for single-policy clients.
- High-performing financial institutions added 1.34 new products per digital-banking user in 2024. That’s 24% above mid-tier performers and roughly double the low performers.[37]
- Banks put 33.7% of marketing budget into new-customer acquisition, against 22.9% for retaining and cross-selling existing customers.[38]
- Insurance clients holding five or more policies retained at 84.7% over five years, against 77.1% for single-policy clients.[39]
- About 50% of the average insurance agency’s clients hold just one policy.[39]
- Telecom customers on a fixed-mobile convergence bundle generated 25% higher blended ARPU than standalone fixed and mobile customers.[40]
- A bundle with a 10% price cut would win over 72% of telecom customers surveyed.[40]
- Analytics-driven base-management and cross-sell programs cut telecom churn by 3% to 6%.[40]
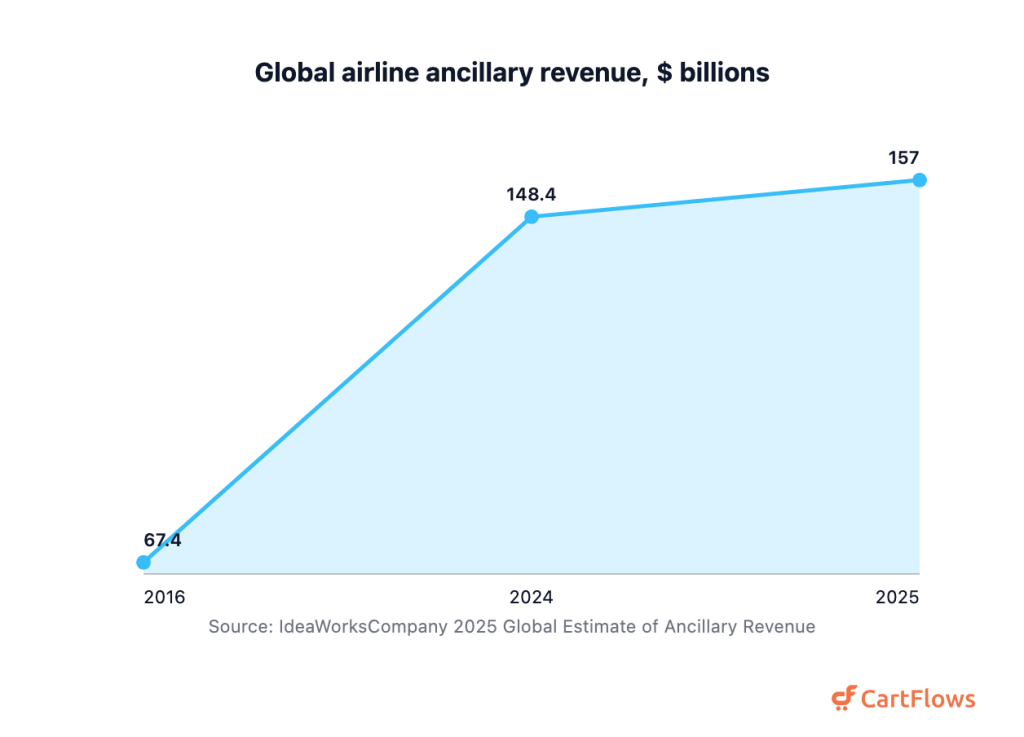
- Airline ancillary revenue reached 15.7% of total airline revenue in 2025, up from 9.1% in 2016.[41]
- Global airline ancillary revenue was projected at $157B for 2025, against $148.4B in 2024 and $67.4B in 2016.[41]
- Ancillary share varied from 3.2% to 62% across individual airlines.[41]
Insurance and telecom show the cleanest link between products per customer and retention. Banking shows the widest gap between what’s intended and what’s actually budgeted.
Airlines are the outlier worth studying. They’ve built the add-on into the fare itself.
When cross-selling backfires
Between 10% and 35% of a firm’s cross-buying customers are unprofitable, measured across five companies’ customer databases in peer-reviewed 2012 research.[9] Those same customers accounted for 39% to 88% of total customer loss. Cross-selling to the wrong person doesn’t just underperform, it costs money.
- 10% to 35% of a firm’s cross-buying customers turned out to be unprofitable, across five firms’ databases in consumer and B2B markets.[9]
- Those unprofitable cross-buyers drove 39% to 88% of each firm’s total customer loss.[9]
- 1,534,280 unauthorized deposit accounts were identified in the Wells Fargo cross-selling scandal.[42]
- The 2016 penalty totaled $185M. That split into $100M to the CFPB, $35M to the OCC and $50M to the City and County of Los Angeles.[42]
- The bank’s own review found 2 million+ deposit and credit-card accounts that customers may not have authorized.[42]
- A combined DOJ and SEC settlement reached $3B in 2020 over the same sales practices, including a $500M SEC civil penalty.[43]
- The famous 35% Amazon recommendation figure is a 2013 McKinsey estimate about purchases. Amazon has never confirmed it, and pages still cite it as current 2026 data.[10]
- The claim that acquiring a customer costs 5x more than retaining one traces to late-1980s research. It’s published as a debunked loyalty myth.[44]
- 80% of marketers investing in personalization would abandon it by 2025, a December 2019 prediction that no follow-up study confirms.[45]
Here’s the part the rest of this search results page skips. Cross-selling has a documented downside, and it isn’t small. A minority of cross-buyers can drive most of a firm’s customer churn, and one bank’s cross-sell targets produced 1.5 million accounts nobody asked for.
Then there’s the citation problem. Three numbers circulate as facts here, and none of them holds up as one. The 35% Amazon line is an outside estimate about purchases from 2013. The 5x retention claim is a documented loyalty myth. The 80% figure was a forecast nobody followed up on.
Putting these numbers to work
Attach rate is the one metric here you can measure yourself this week, and it’s cheap to calculate. Divide the orders containing an add-on by total orders. Then watch it move as you change placement and timing.
If you run WooCommerce, there’s a short path to a comparable number: offers that adapt to cart contents. Our guide to setting up WooCommerce product recommendations walks through the setup.
Sources and Methodology
Every figure on this page was traced to the organization that measured it. Anything we couldn’t reach a primary for was dropped rather than softened. That removed 48 claims.
Four widely cited “reports” that competing pages build on don’t exist at all, with no matching publication from the organizations credited.
No verifiable industry-wide post-purchase upsell take rate exists either, so we don’t publish one. This page gives only single-merchant and single-platform figures, labeled as such. Treat them as examples, not benchmarks.
SaaS expansion-revenue benchmarks genuinely conflict between publishers, and we haven’t resolved that disagreement silently. One widely quoted figure puts expansion near a third of new ARR even for top performers. The 40% median cited above comes from the reachable primary.
Final Thoughts
What stands out after chasing every one of these numbers to its origin isn’t the data itself. It’s how much of this topic runs on figures nobody can verify. Several of the most quoted reports behind the top-ranking pages don’t exist.
The benchmark we most wanted, an industry-wide post-purchase take rate, has quietly gone offline. It survives only as a copied fragment.
So treat any cross-sell benchmark you’re handed, including this page, as a starting hypothesis rather than a target. Your own attach rate, measured on your own orders, beats every published median. And the research on unprofitable cross-buying is a useful reminder that more products per customer isn’t automatically more profit.
Frequently Asked Questions
Last updated August 24, 2026.
References
1. HubSpot
3. Klaviyo
4. SamCart
5. Salesforce
6. Nosto
7. Attentive
8. Benchmarkit
10. New America
11. HubSpot
12. Gartner
13. AfterSell
14. Rebuy
15. Bloomreach
16. Google Cloud
19. Klaviyo
21. Omnisend
22. Omnisend
23. Postscript
24. Omnisend
25. Klaviyo
26. Coveo
27. Coveo
28. Bloomreach
29. Salesforce
30. Alchemer
31. Algolia, via Digital Commerce 360
32. NRF
33. SaaS Capital
34. SaaS Capital
35. High Alpha
36. Maxio
37. Cornerstone Advisors, via Alkami
39. MarshBerry
40. Simon-Kucher
41. IdeaWorksCompany
42. CFPB
43. US Securities and Exchange Commission
44. Ipsos Loyalty
45. Gartner