US shoppers spent a record $11.8 billion online on Black Friday 2025, up 9.1% on the year before.[1] Black Friday 2026 falls on Friday, November 27, and a September 28, 2026 forecast puts it at $12.9 billion.[1] Below are 175+ figures on sales, discounts, consumers, mobile, BNPL, AI and retail trends, each traced to its source.
Black Friday at a glance
- US shoppers spent $11.8 billion online on Black Friday 2025, a record and 9.1% more than in 2024.[1]
- Black Friday 2026 falls on November 27, and US online spend that day is forecast at $12.9 billion, up 9.2%, in a forecast published September 28, 2026.[1]
- Cyber Monday remained the biggest US online shopping day of 2025, at $14.25 billion.[1]
- Prices on Black Friday 2025 averaged 23.7% below listed price across tracked categories, the deepest average discount of any day that season.[1]
- Electronics carried the deepest 2025 holiday discount of any category, peaking at 30.9% off listed price.[1]
- A record 202.9 million Americans shopped in stores or online over the 2025 Thanksgiving weekend, from Thanksgiving Day through Cyber Monday.[2]
- Mobile devices drove $6.5 billion of US online spend on Black Friday 2025, a 55.2% share of the day.[1]
- Traffic from generative AI tools such as chatbots to US retail sites grew 805% year over year on Black Friday 2025.[1]
- Shopify merchants sold $14.6 billion worldwide over the 2025 Black Friday Cyber Monday weekend, up 27%.[3]
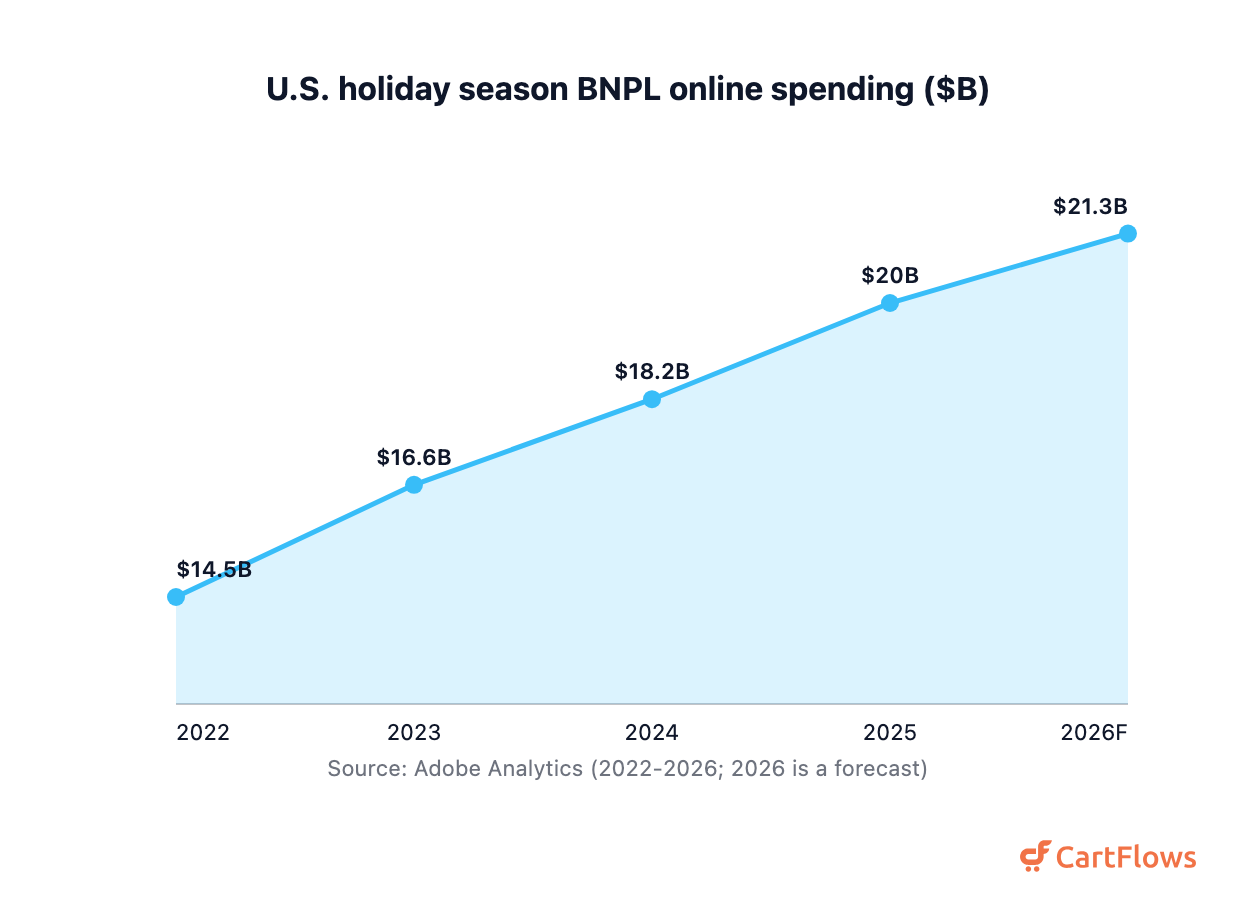
- Buy now, pay later drove a record $20.0 billion of US online holiday spend in 2025.[1]
Table of contents
- Black Friday 2025 sales totals
- Cyber Week and the full holiday season
- Black Friday 2026 forecasts
- Black Friday discounts: how much prices drop
- Black Friday shoppers and foot traffic
- Holiday shopping statistics: surveys and spending plans
- Mobile, BNPL and payments on Black Friday
- AI shopping assistants on Black Friday
- Email, SMS and social commerce
- Merchant and platform results
- Small Business Saturday and Giving Tuesday
- Black Friday statistics that don’t hold up
- Sources and methodology
- Frequently Asked Questions
Black Friday 2025 sales totals
Black Friday 2025 set a US online spending record of $11.8 billion on November 28, up 9.1% from 2024.[1] That figure is measured consumer spend on US retail websites. It’s the second-biggest online day of the holiday season, behind Cyber Monday, but it grew faster.
- Online growth on Black Friday beat Cyber Monday’s for the second straight year. Black Friday rose 9.1% in 2025 while Cyber Monday rose 7.1%.[1]
- $10.8 billion was spent online on Black Friday 2024, up 10.2%. That’s the base 2025’s growth was measured against.[1]
- The October 2025 forecast for Black Friday online spend was $11.7 billion, up 8.3%. The actual result landed $0.1 billion higher.[1]
- Shoppers on mobile devices spent $6.5 billion online on Black Friday 2025, up 10.2%, which was 55.2% of the day’s total.[1]
- Buy now, pay later accounted for $747.5 million of US online spend on Black Friday 2025. By our arithmetic, that’s about 6.3% of the day.[1]
- Global Black Friday 2025 online sales reached $79 billion, up 6%. That figure is an industry-wide estimate extrapolated from one commerce platform’s shopper data.[4]
- Using the same extrapolation method, US online sales on Black Friday 2025 came to $18 billion, up 3%. It’s a different measure from the $11.8 billion of observed spend.[4]
- Stores had their biggest day of Cyber Week on Black Friday. It took 31% of all in-store sales during the seven days from November 25 to December 1, 2025.[4]
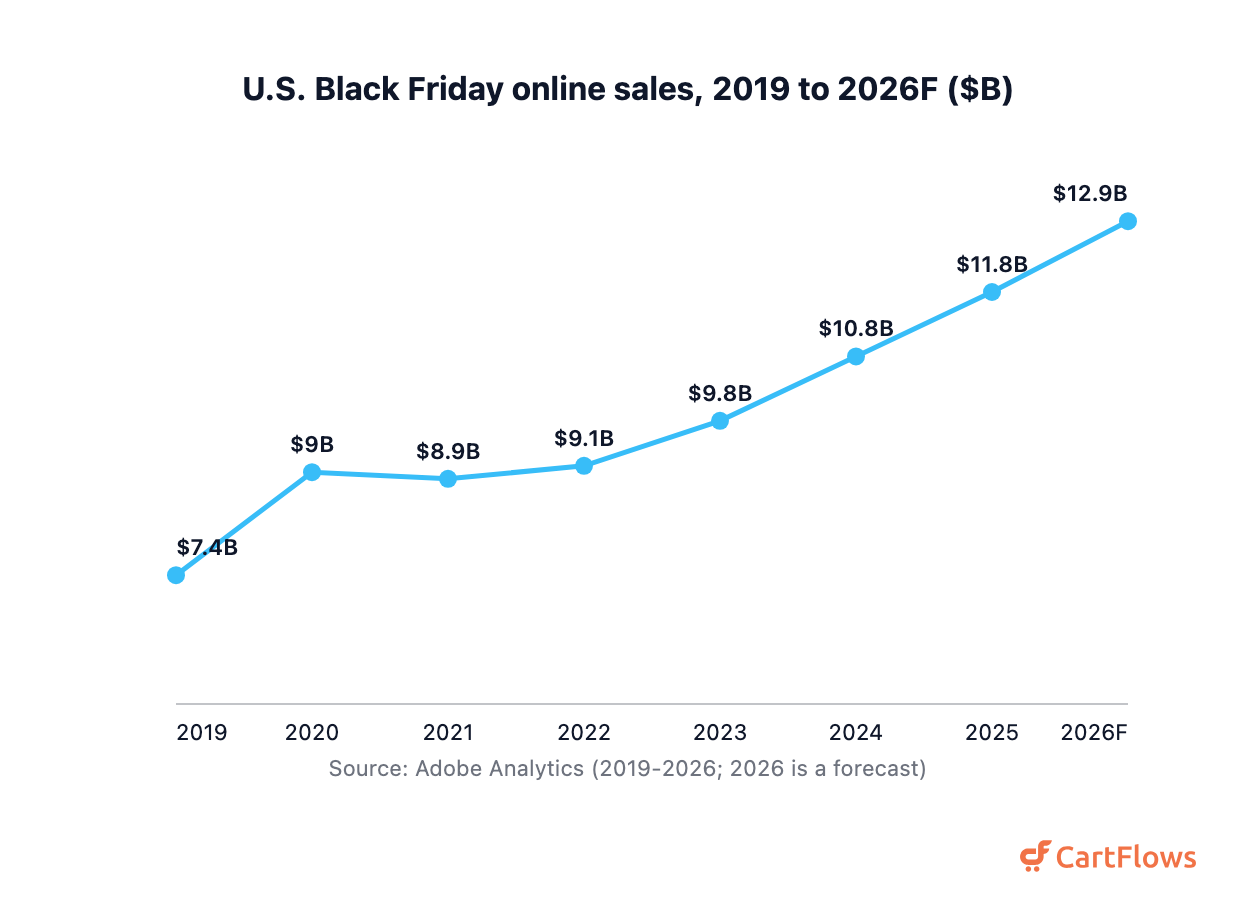
The longer run shows how steady the climb has been. Black Friday online spend was $7.4 billion in 2019[1] and $9.0 billion in 2020.[1] It slipped to $8.9 billion in 2021.[1] That’s the only decline in the series.
From there it’s been up every year. Spend reached $9.1 billion in 2022, $9.8 billion in 2023, $10.8 billion in 2024 and $11.8 billion in 2025.[1] The 2026 forecast of $12.9 billion would add another billion.[1]
Cyber Week and the full holiday season
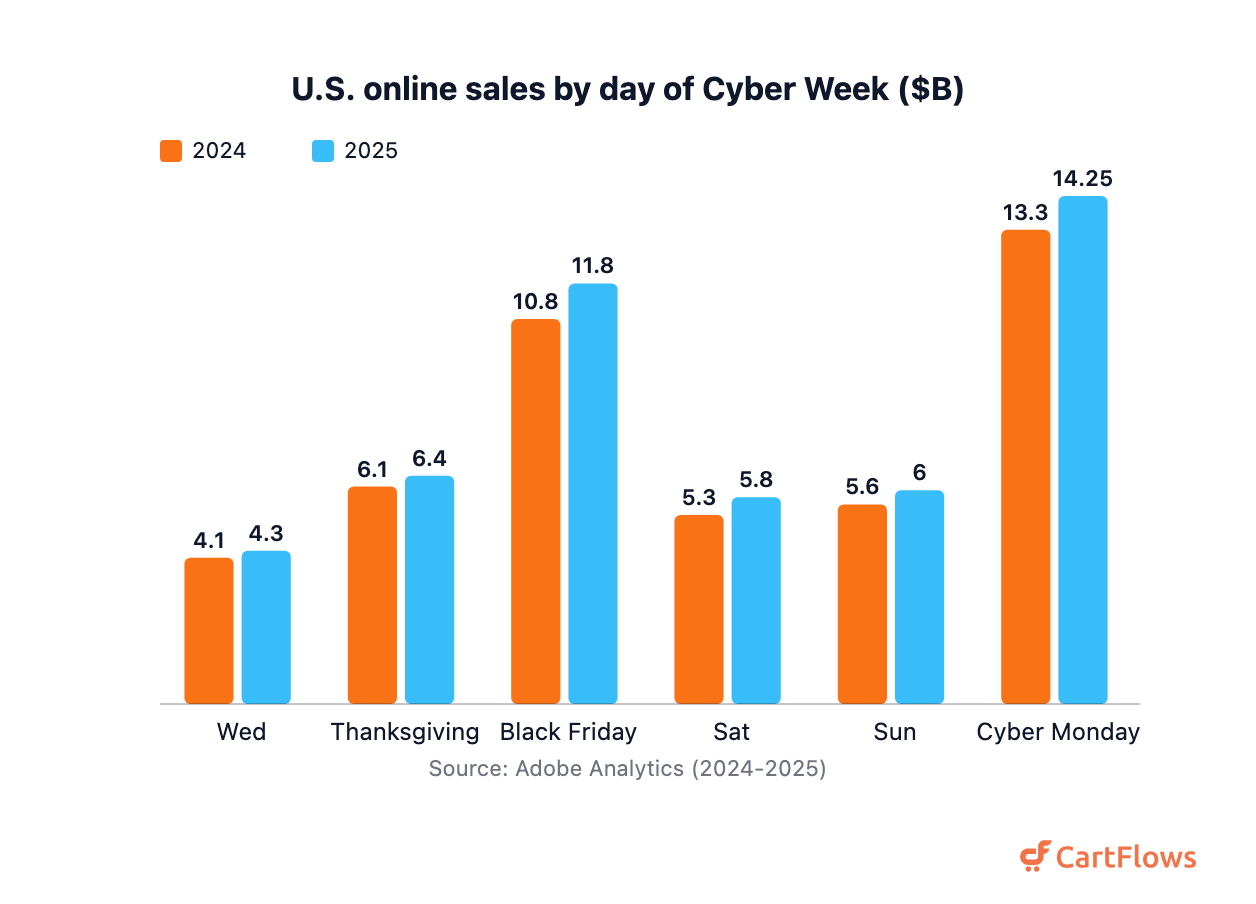
Cyber Monday stayed the biggest US online shopping day of 2025 at $14.25 billion, up 7.1%.[1] Across Cyber Week, the five days from Thanksgiving to Cyber Monday, shoppers spent $44.2 billion online, 7.7% more than a year earlier.[1] Black Friday grew faster. Cyber Monday’s still bigger.
Here’s how each day compared with 2024, in billions of dollars of US online spend.[1]
| Day | 2024 ($B) | 2025 ($B) |
|---|---|---|
| Wednesday before Thanksgiving | 4.1 | 4.3 |
| Thanksgiving Day | 6.1 | 6.4 |
| Black Friday | 10.8 | 11.8 |
| Saturday | 5.3 | 5.8 |
| Sunday | 5.6 | 6.0 |
| Cyber Monday | 13.3 | 14.25 |
- Thanksgiving Day 2025 generated $6.4 billion in US online spend, up 5.3% on the holiday a year earlier.[1]
- $5.8 billion was spent online on Saturday, November 29, 2025. That’s 9.5% more than the same Saturday in 2024.[1]
- Together, that Saturday and Sunday produced $11.8 billion of US online spend in 2025, up 8.7%. The weekend matched Black Friday on its own.[1]
- Cyber Week took 17.1% of all US online holiday spend in 2025, packed into just five days.[1]
- Across November and December 2025, US online holiday spend hit a record $257.8 billion, up 6.8% from $241.4 billion.[1]
- That season total beat the October 2025 forecast. The $253.4 billion forecast came in $4.4 billion short of the final result.[1]
- US online spend topped $4 billion on 25 days of the 2025 season, up from 18 days in 2024.[1]
- Three categories took 54% of US online holiday spend in 2025. Electronics brought in $59.8 billion, apparel $49.0 billion and furniture and home $31.1 billion.[1]
- Online grocery was the fastest-growing big category of the 2025 season. It rose 10.2% to $23.7 billion, while cosmetics rose 9.3% to $8.4 billion.[1]
- Measured as an extrapolated industry estimate over seven days, global Cyber Week 2025 online sales reached $336.6 billion, with $79.6 billion in the US.[4]
- Growth over the 2025 season was price-led. Average selling prices rose 7% in the US while US online order volume grew just 1%.[4]
- Holiday retail sales rose 4.1% to just over $1 trillion in November and December 2025, excluding autos, gas and restaurants.[2]
- By January 8, 2026, shoppers had already sent back $181 billion of global online holiday purchases, 14% of everything bought that season.[4]
Black Friday’s one day in a two-month season. For the year-round numbers behind it, our ecommerce statistics page covers market size, growth and channel share.
Black Friday 2026 forecasts
Black Friday 2026 is Friday, November 27, and it’s forecast to bring $12.9 billion of US online spend, up 9.2% on 2025.[1] That forecast, published September 28, 2026, also puts the full November and December holiday shopping season at a record $275.1 billion online, up 6.7%.[1]
Every figure in this section is a forecast. None are results yet, and we’ll update them after the weekend.
US online forecasts by day and category
- Cyber Monday, November 30, 2026, is forecast at $15.1 billion, up 6.2%. That would make it the first US online day above $15 billion (forecast published September 28, 2026).[1]
- Thanksgiving Day, November 26, 2026 is forecast to reach $6.9 billion online, up 8.5%, in the same September 28 forecast.[1]
- $47.5 billion is the forecast for US online spend across the five days of Cyber Week 2026. That’s up 7.4% and 17.3% of the season.[1]
- Electronics should stay the largest online holiday category. Its 2026 season spend is forecast at $63.3 billion, up 5.9%.[1]
- Online apparel is forecast at $51.3 billion for the 2026 season, up 4.7%. Furniture is forecast at $33.4 billion, up 7.3%.[1]
- At $26.1 billion, up 10.3%, online grocery is forecast to be the fastest-growing major category of the 2026 holidays.[1]
- Ecommerce is forecast to take $1 of every $4 spent on retail goods over the 2026 holidays.[1]
Total retail forecasts for the 2026 holidays
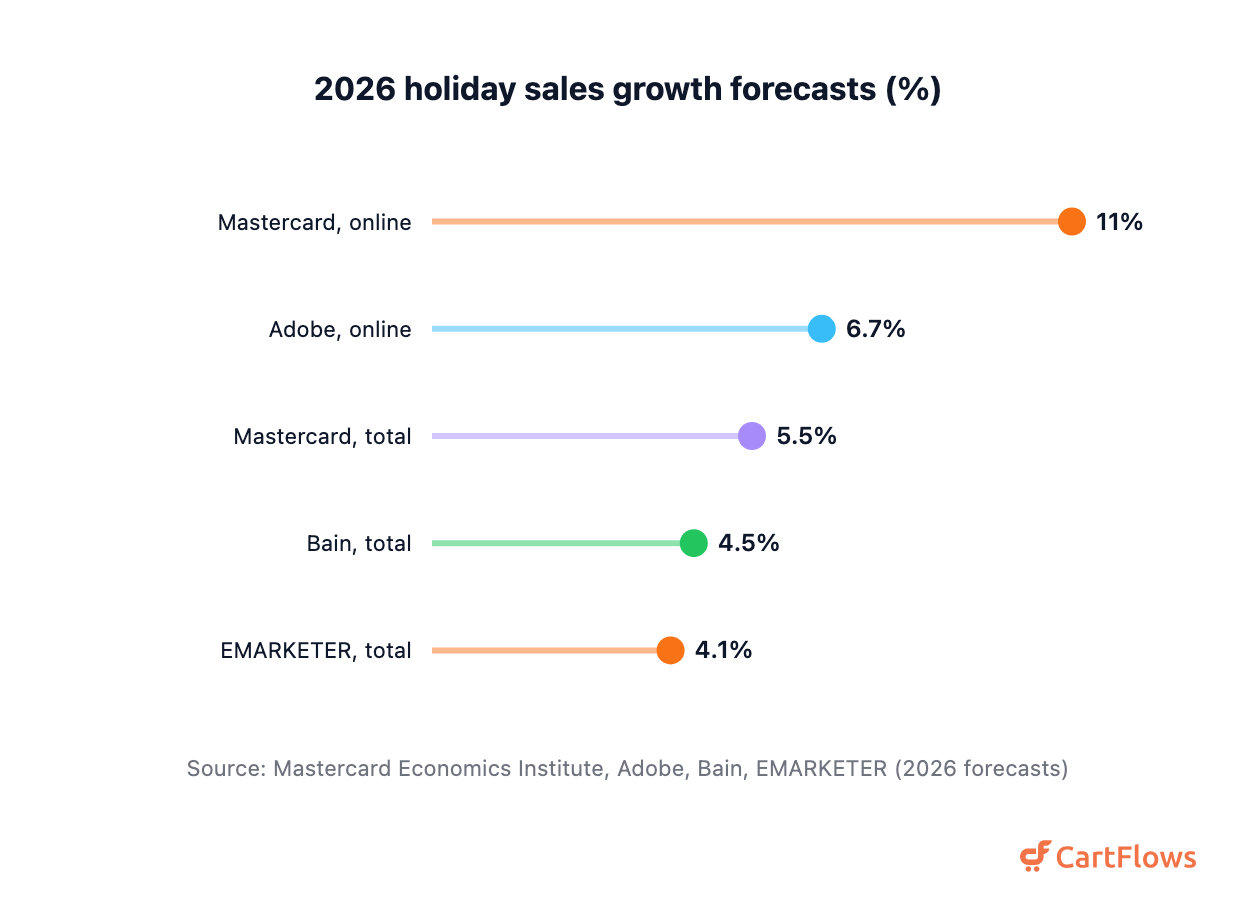
- US retail sales excluding autos and gas are forecast to grow 5.5% from November 1 to December 24, 2026. That forecast, published September 23, 2026, would be the strongest holiday growth since 2022.[5]
- Split by channel, that same forecast expects 11% growth online and 3.6% in store for the 2026 holidays.[5]
- About half of the 2026 holiday spending growth is expected to come from higher prices rather than more units.[5]
- Holiday retail sales from November 2026 to January 2027 are forecast at $1.70 trillion to $1.71 trillion, up 4.0% to 4.8%, excluding autos and gasoline. That forecast was published September 10, 2026.[6]
- Holiday ecommerce over the same November to January window is forecast at $316.1 billion to $318.9 billion, up 7.5% to 8.4%.[6]
- Total US retail sales for November and December 2026 are forecast to rise 4.5% and pass $1 trillion, with nonstore sales up 9% and in-store up 2.5%. That one was published September 3, 2026.[7]
- A forecast published July 16, 2026 expects total US retail sales to rise 4.1% in November and December 2026, trailing the full-year average for the second year running.[8]
Don’t line those growth rates up as if they’re one ranking. The 11% and 6.7% forecasts are online only. The 5.5% covers all retail excluding autos and gas through December 24. The 4.5% and 4.1% forecasts cover total retail for November and December.
Black Friday discounts: how much prices drop
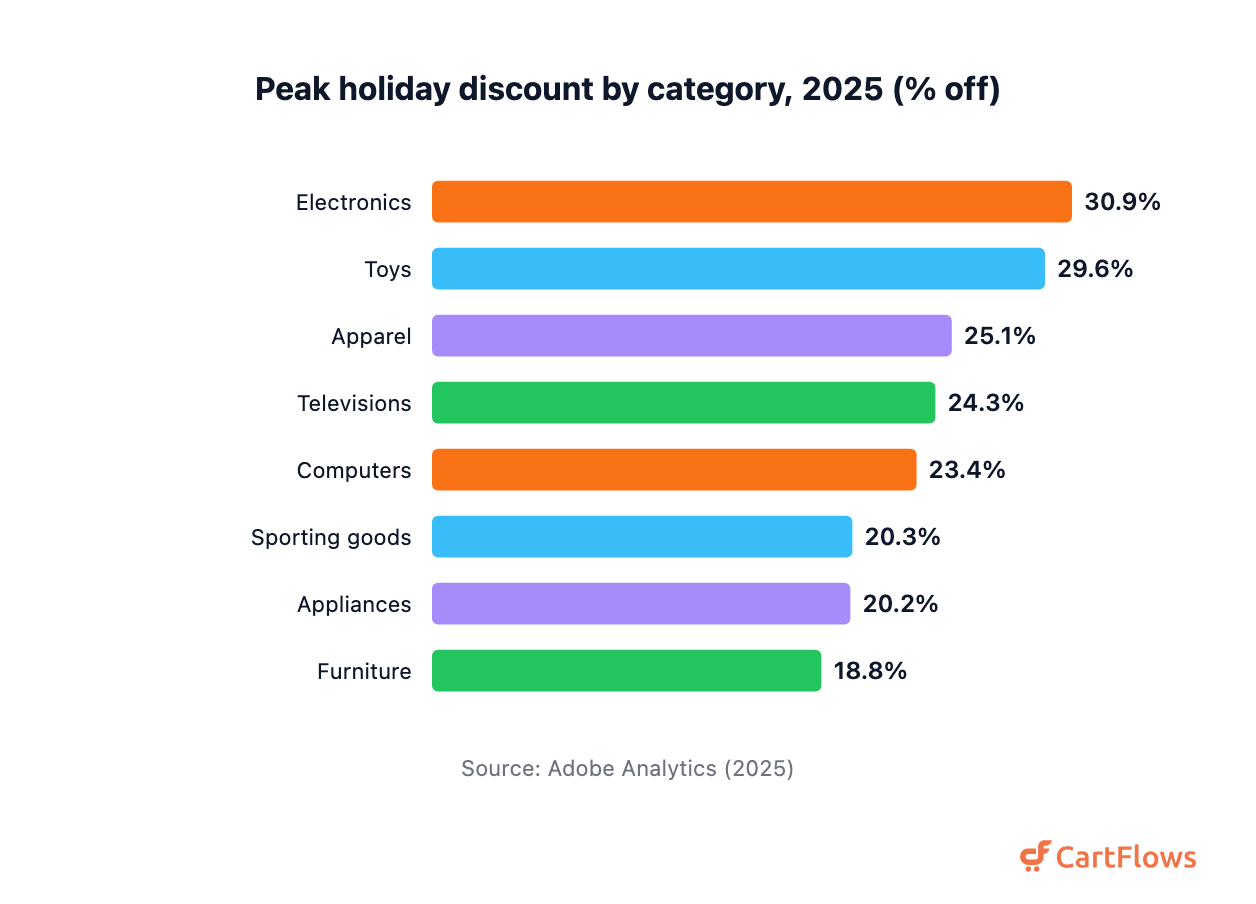
Prices dropped an average of 23.7% off listed price on Black Friday 2025, the deepest discount of any day that season and up from 22.2% in 2024.[1] That’s an average across tracked categories. Individual categories went further: electronics peaked at 30.9% off and toys at 29.6%.[1]
So how much discount should you expect? It depends on which number you’re reading. There are three kinds on this page: the daily average across product categories, the peak for a single category, and the average markdown across every listed item.
Average discount by day
- Thanksgiving Day 2025 averaged 22.7% off listed price across tracked categories, up from 21.6% in 2024.[1]
- Cyber Monday 2025 came in slightly shallower than Black Friday. Its average discount was 22.9% off, up from 21.9%.[1]
- Four categories hit their deepest single-day discount of the 2025 season on Black Friday. Toys, TVs, sporting goods and appliances all hit their lowest prices that day.[1]
- On Black Friday 2025 itself, electronics averaged 28.7% off and apparel 24.9% off, both short of their Cyber Monday peaks.[1]
Peak discount by category in 2025
- Electronics peaked at 30.9% off listed price during the 2025 holiday season, up from 30.1% and the deepest of any category.[1]
- Toys reached 29.6% off on Black Friday 2025, against a 28% peak the year before.[1]
- 25.1% off was apparel’s deepest 2025 discount, reached on Cyber Monday and up from 23.2%.[1]
- TV prices bottomed out on Black Friday 2025. The peak TV discount was 24.3% off, barely changed from 24.2%.[1]
- Computers hit their 2025 low on Thanksgiving Day, at 23.4% off listed price.[1]
- The sporting goods peak of 20.3% off arrived on Thanksgiving 2025 and was matched on Black Friday.[1]
- Appliances peaked at 20.2% off on Black Friday 2025, up from 19.2% the year before.[1]
- Furniture was the only category to get less generous. Its 2025 peak of 18.8% off came in below 2024’s 19%.[1]
- Discounts pulled shoppers up-market. The share of units sold for the most expensive goods rose 20% over the 2025 season, compared with the rest of the year.[1]
What the 2026 discount curve looks like
- Peak discounts for the 2026 season are forecast at up to 30% off listed price, arriving during Cyber Week (forecast published September 28, 2026).[1]
- Early November 2026 discounts are forecast to reach up to 14% off, rising to 21% just before Thanksgiving. After Cyber Week they’re forecast to ease to 10% to 15% through December.[1]
- Black Friday 2026 is forecast to carry the deepest deals for 5 categories: TVs, toys, apparel, appliances and furniture. Electronics and computers are forecast to bottom out on Cyber Monday.[1]
- Category peaks for 2026 are forecast at 30% off for electronics and 29% for toys, with TVs, computers and apparel at 23% each.[1]
- Electronics prices are rising underneath the deals. The PCE price index for video, audio, photo and computing equipment was up 12.2% year over year heading into the 2026 holidays.[5]
If you’re planning a store-wide sale for the 2026 window, you can schedule a Black Friday coupon that switches itself off when the deal ends. That way it doesn’t run into December by accident.
Item-level and promotion discounts
Item trackers measure something else. They average the markdown across every listed product, not just the ones on promotion, so they’ll always run much lower.
- Across 10,356 US consumer-electronics products, the average pre-Black Friday discount was 14.6% in 2025. Black Friday week, November 24 to December 1, added a further 2.6 points.[9]
- Apparel got the biggest Black Friday week boost. Across 21,749 US apparel products, the extra discount averaged 3.8 points on top of a 13.8% pre-Black Friday markdown in 2025.[9]
- Grocery had the thinnest markdowns tracked, 5.2% before Black Friday 2025 plus 1.5 points during the week.[9]
- Promotions sent by Klaviyo brands over BFCM 2025 offered an average discount of 26.2%, down from 29.1% a year earlier.[10]
- The latest published Cyber Week average from an extrapolated industry panel is 28% off in the US and 26% globally, for 2024.[4]
- Of 1,500+ products tracked from October 1 to December 1, 2025, 33% weren’t at their season-low price on their Black Friday or Cyber Monday deal.[11]
Black Friday shoppers and foot traffic
A record 202.9 million Americans shopped in stores or online over the five days from Thanksgiving to Cyber Monday 2025, up from 197 million in 2024.[2] Black Friday stayed the busiest shopping day, with 80.3 million in-store shoppers and 85.7 million online. That’s slightly fewer on both counts than in 2024.[2]
Shopper counts and spend per shopper
- 129.5 million people shopped in stores over the 2025 Thanksgiving weekend, up 3%.[2]
- Online shoppers grew three times as fast. Their count rose 9% to 134.9 million over the same five days of 2025.[2]
- Small Business Saturday 2025 drew 62.7 million in-store and 63 million online shoppers, up from 61.1 million and 53.9 million.[2]
- Cyber Monday 2025 pulled in 75.9 million online shoppers, against 64.4 million a year earlier.[2]
- Holiday spend per Thanksgiving-weekend shopper averaged $337.86 in 2025, the highest since 2019 and up from $315.56.[2]
Spending growth: stores versus online
Card and cash spending data tells the same split story. Online sales grew fast on Black Friday 2025, while in-store shopping at physical stores barely moved.
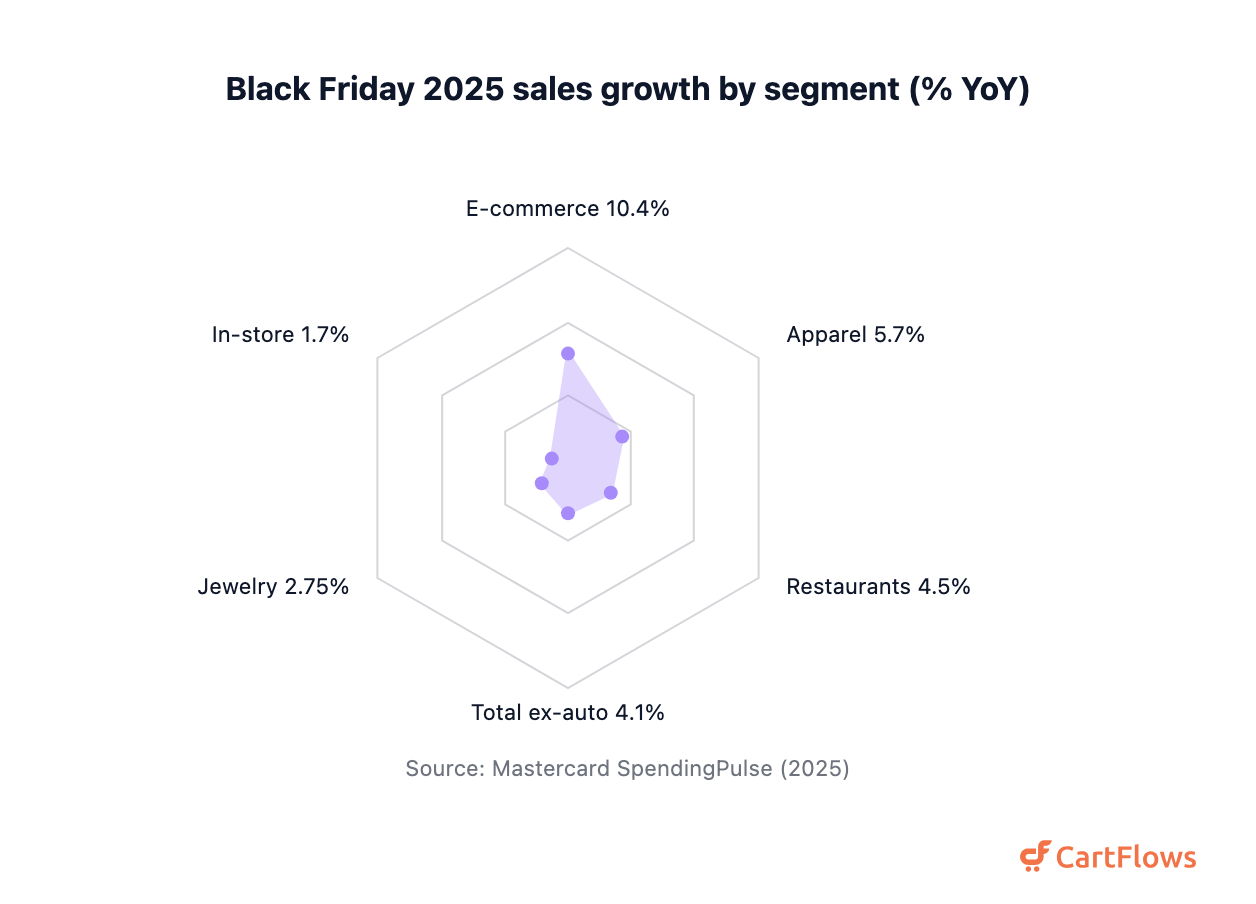
- Counting in-store and online sales across all payment types, US retail sales excluding autos rose 4.1% on Black Friday 2025. The figure isn’t adjusted for inflation.[5]
- Ecommerce sales excluding autos grew 10.4% year over year on Black Friday 2025.[5]
- Stores lagged well behind. In-store sales excluding autos rose just 1.7% on Black Friday 2025.[5]
- Apparel sales climbed 5.7% on Black Friday 2025, with online apparel up 6.1% and in-store apparel up 5.4%.[5]
- Restaurants did better than stores overall. Restaurant sales rose 4.5% on Black Friday 2025 against the prior year.[5]
- Jewelry grew least of the tracked segments. Its sales rose 2.75% on Black Friday 2025, with online jewelry up 4.2%.[5]
Foot traffic on Black Friday 2025
- Door-counter data showed US in-store traffic fell 1.7% on Black Friday 2025 against 2024. That final figure was revised from an initial 2.1% drop.[12]
- Compared with the Friday before, Black Friday 2025 store traffic jumped 248.9%.[12]
- A second door-counter panel measured a 3.6% traffic drop on Black Friday 2025, and a 5.8% drop from Friday through Monday.[13]
- Fewer visitors still spent more. In-store net sales rose 1.0% on Black Friday 2025, as average transaction value climbed 2.2%.[13]
- Even with the dip, Black Friday was the single highest in-store traffic day of 2025.[13]
- Mobile-location data counted 53.04 million US store visits on Black Friday 2025, up 1.17% year over year.[14]
- Indoor malls saw 3.1% more visits on Black Friday 2025 than a year earlier, and open-air centers 1.7% more.[15]
Why the disagreement? Door counters and phone-location panels don’t sample the same stores. And shopping spread into Saturday and Sunday, which is why the five-day total still set a record.
Holiday shopping statistics: surveys and spending plans
Consumers planned to spend an average of $890.49 each on gifts, food and decorations for the 2025 holidays, the second-highest figure in 23 years of tracking.[2] That’s 1.3% below 2024’s record. And most people said they’d wait: 63% planned to do most of their shopping over Thanksgiving weekend.[2]
These are survey answers about plans, not measured sales. They’re useful for timing and intent. Don’t add them to the spend totals above.
What shoppers planned for 2025
- Tariffs shaped expectations. 85% of 2025 holiday shoppers said they expected higher prices because of them.[2]
- Planned spend for Thanksgiving through Cyber Monday averaged $622 per shopper in 2025, down 4%. It was the first decline after four years of growth.[6]
- Participation still rose. 82% of consumers planned to shop the 2025 BFCM period, up from 79% in 2024.[6]
- Gen Z led in-store intent. 72% of Gen Z planned to shop in a store on Black Friday 2025, against 49% of all shoppers.[6]
- Picky buyers were common: 38% of BFCM 2025 shoppers planned to buy only items at least 50% off.[6]
- Carts filled up early. 60% of shoppers already had items waiting in their carts ahead of BFCM 2025.[6]
- Including travel and entertainment, planned holiday spend averaged $1,552 in 2025, down 5%, the first notable drop since 2020.[16]
- Gift budgets fell harder. Planned gift spend dropped 11% to $721 in 2025, from $814 in 2024.[16]
- Shoppers expected to spend 39% of their 2025 gift budget in the five days from Thanksgiving to Cyber Monday, and about 80% by the end of Cyber Monday.[16]
- In an October 2025 survey of 2,050 adults, 64% of Americans planned to shop on Black Friday 2025, and 32% expected to spend $500 or more.[17]
- Store preference jumped. 51% of shoppers said they preferred to shop in store on Black Friday 2025, up from 31% a year earlier.[4]
How the 2025 weekend actually played out
- Among 9,199 verified buyers, 56% of Cyber Weekend 2025 shoppers bought mostly or only online, against 16% mostly or only in store.[18]
- Black Friday was the weekend’s most-shopped day, visited by 76% of Cyber Weekend 2025 buyers. Cyber Monday reached 59%.[18]
- Amazon reached 87% of Cyber Weekend 2025 buyers, Walmart 65% and Target 42%.[18]
- Almost nobody stayed loyal to one store. 93% of Cyber Weekend 2025 buyers bought from two or more retailers.[18]
What shoppers plan for 2026
- Planned gift spend for 2026 averages $708 per person, down 2% from $721. The survey of 4,093 US consumers was fielded June 15-26 and published September 8, 2026.[16]
- Travel takes the biggest hit. Planned 2026 holiday travel spend falls 24% to $419 per consumer, and 40% plan to travel.[16]
- Trading down is widespread. 35% of holiday shoppers say they’re trading down for 2026, in a survey published July 20, 2026.[4]
Mobile, BNPL and payments on Black Friday
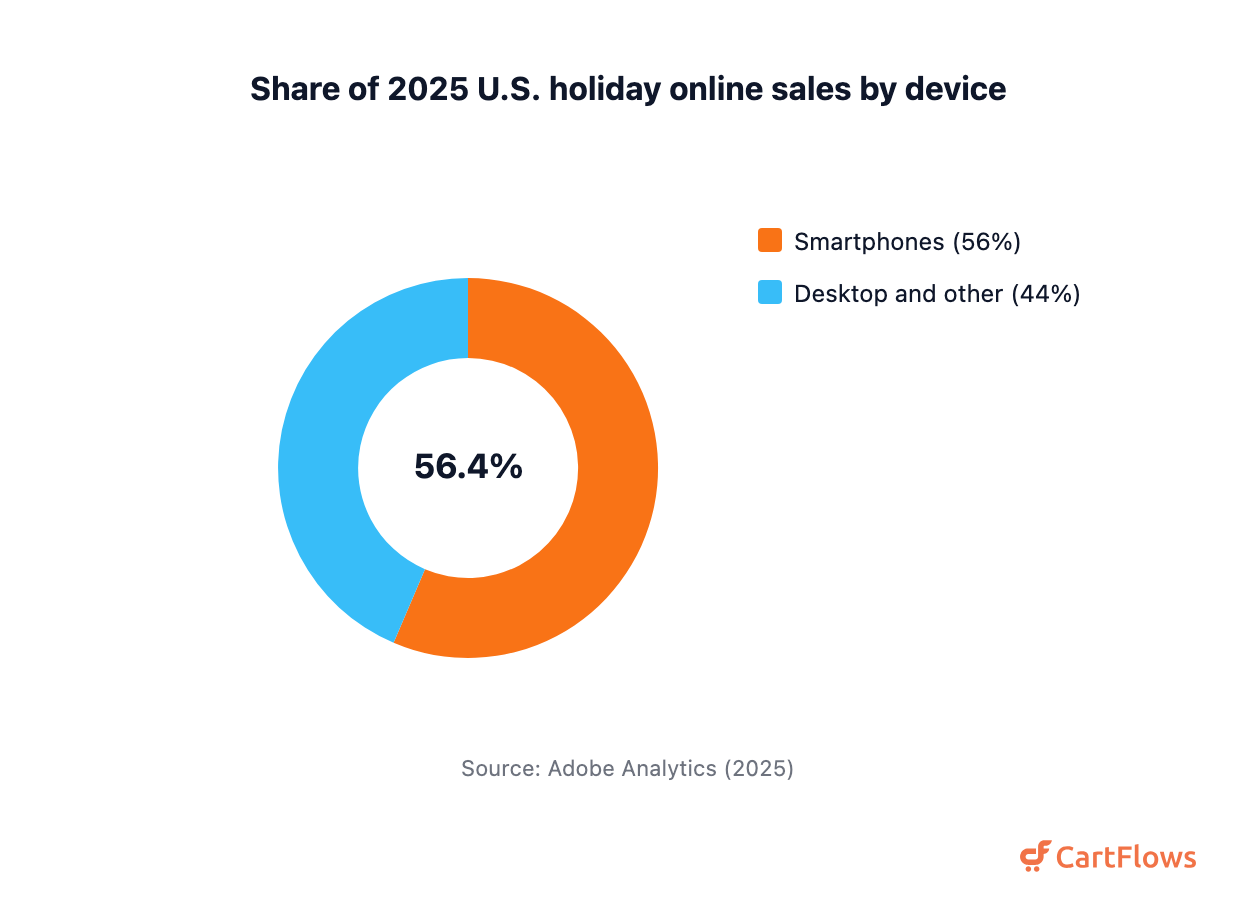
Smartphones drove 56.4% of US online holiday spending in 2025, up from 54.5% a year earlier.[1] That leaves 43.6% for desktops and other devices, by our arithmetic. Mobile spend for the season reached $145.2 billion, up 10.7%.[1] The phone’s now the default checkout.
Mobile shopping
- Thanksgiving Day 2025 was the first day with mobile above 60%. Phones took 61.6% of US online sales that day, or $3.9 billion.[1]
- 57.5% of Cyber Monday 2025 online spend came from mobile devices, worth $8.2 billion and up 8%.[1]
- Measured by orders rather than dollars, 70% of Cyber Week 2025 online orders were placed on mobile devices.[4]
- Mobile wallets paid for 29% of US Cyber Week 2025 orders and 27% of orders globally.[4]
- Mobile’s share of 2026 holiday online spend is forecast at 57.4%, in a forecast published September 28, 2026.[1]
- Thanksgiving 2026 is forecast to set a record 63% mobile share of US online spend.[1]
- Forecast mobile spend on Thanksgiving Day 2026 comes to $4.4 billion, up 11%.[1]
If most of your Black Friday traffic arrives on a phone, the checkout is where it’s won or lost. Our checkout optimization statistics page covers form fields, speed and payment methods in detail.
Buy now, pay later
Buy now, pay later drove a record $20.0 billion of US online holiday spend in 2025, up 9.8% and $1.8 billion more than in 2024.[1] It’s grown every year: $14.5 billion in 2022, $16.6 billion in 2023 and $18.2 billion in 2024.[1]
- Cyber Monday 2025 became the first BNPL day above $1 billion, at $1.03 billion, up 4.2%.[1]
- Across the five days of Cyber Week 2025, BNPL online spend totaled $3.1 billion.[1]
- Phones carried 82.2% of 2025 holiday BNPL revenue, up from 79.1%. That mobile BNPL spend came to $16.4 billion, up 13.9%.[1]
- The 2026 forecast calls for a record $21.3 billion of BNPL holiday spend, up 6.6%, with 82% via mobile (published September 28, 2026).[1]
- BNPL spend on Black Friday 2026 is forecast at $807 million, and on Cyber Monday 2026 at $1.09 billion.[1]
- Credit was on most shoppers’ minds. 64% of BFCM 2025 shoppers planned to pay with credit cards or BNPL.[6]
- Asked to rank payment methods, only 9% of 2025 shoppers put BNPL in their top three, against 55% for debit cards and 52% for credit cards.[16]
AI shopping assistants on Black Friday
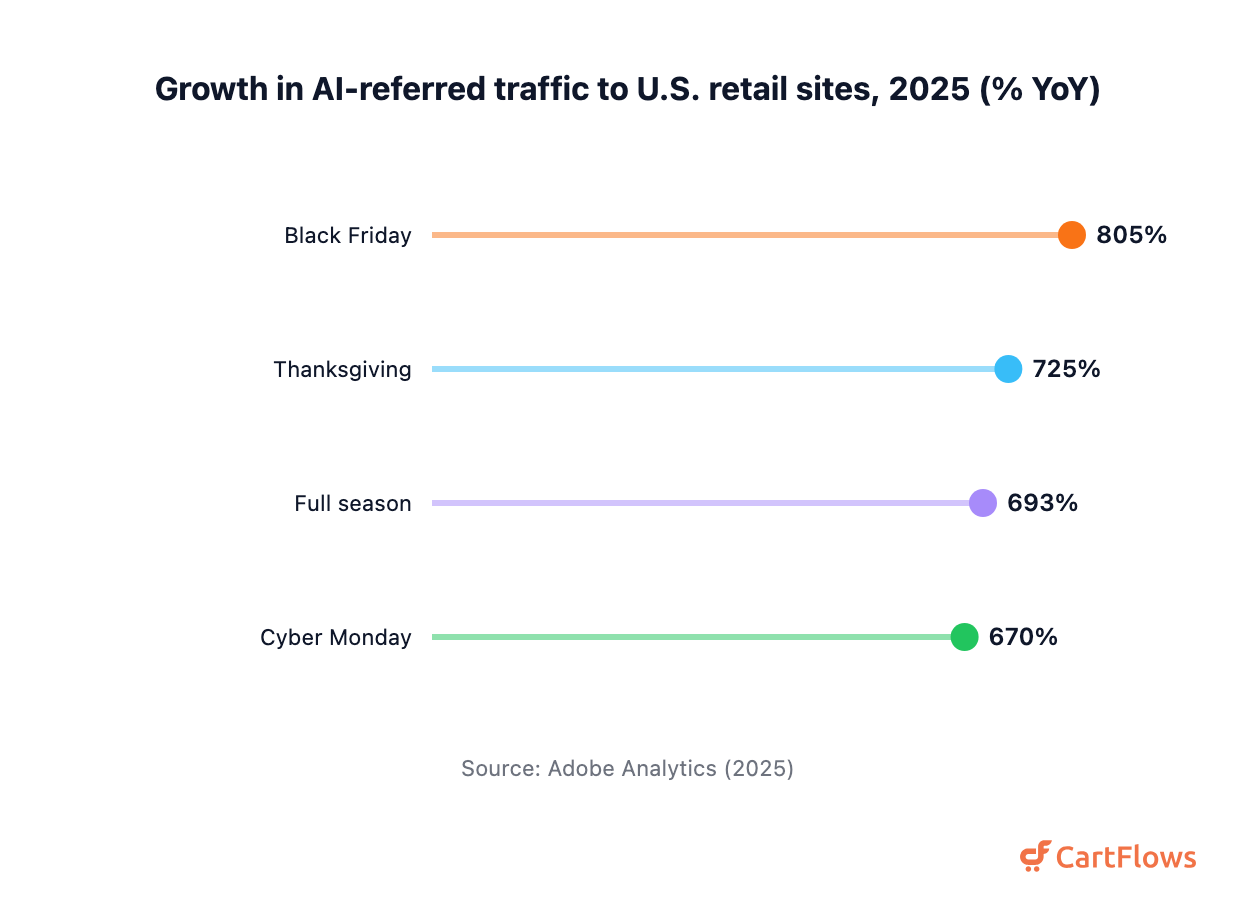
Traffic from generative AI tools such as chatbots to US retail sites grew 805% year over year on Black Friday 2025.[1] Those visitors converted 38% better than other traffic that day.[1] The base is still small, so the growth percentages look enormous. It’s the conversion gap that matters.
- Across the full 2025 holiday season, AI-referred traffic to US retail sites posted 693% year-over-year growth (693.4% unrounded), with November up 769% and December up 673%.[1]
- Thanksgiving 2025 saw 725% growth in AI-referred retail traffic, and Cyber Monday 670%.[1]
How AI shoppers behave
- AI-referred visits converted 31% better than other traffic over the 2025 season, an improvement of almost 100% on the year before.[1]
- The gap was widest on Thanksgiving. AI-referred visits converted 54% better than non-AI visits on Thanksgiving 2025.[1]
- Desktops dominated. 72.1% of AI-referred retail visits came from desktop computers between November 1 and 28, 2025, against 27.9% from mobile.[1]
- In a July 2026 survey of 5,000 consumers, 69% of AI shoppers said they were less likely to return an item, and 77% felt more confident in their purchase.[1]
- A projected 29% of consumers plan to use AI for 2026 holiday shopping, up from 22% in 2025.[16]
- AI doesn’t always close the sale. 64% of AI users still open a separate tab to buy on a website rather than using the AI tool’s link.[16]
AI-influenced sales and the 2026 outlook
- AI and agents influenced $67 billion of global Cyber Week 2025 online sales, touching 20% of global orders.[4]
- Over the whole 2025 season, AI and agents drove $262 billion of global holiday retail sales, 20% of the total.[4]
- Growth is slowing from a bigger base. AI-driven traffic to US retail sites was up 127% in August 2026 on August 2025.[1]
- For the 2026 season, AI-referred traffic is forecast to grow 130% year over year, in a forecast published September 28, 2026.[1]
- Black Friday 2026 AI traffic is forecast to rise 95% year over year, and Cyber Monday 88%.[1]
- A prediction published July 20, 2026 expects 20% of 2026 holiday ecommerce traffic to come from AI chat agents.[4]
Email, SMS and social commerce
Email and text messages drove 43.3% of total revenue for Klaviyo brands on Black Friday 2025.[10] That single day generated more than $1 billion in revenue attributed to those messages, a first for one day.[10] Owned channels still carry the weekend for stores that’ve built a list.
Email and SMS
- Revenue attributed to email, SMS and onsite experiences reached more than $3.8 billion over BFCM 2025, up 27% across the same brands.[10]
- Those brands sent more than 22.7 billion messages over BFCM 2025, 25% more than the year before.[10]
- Across the whole 2025 weekend, email and text drove 42% of total revenue for those brands, rising to 43% on peak days.[10]
- Text messaging kept growing. SMS revenue rose 25% over BFCM 2025, on 34% more sends.[10]
- Consumer spending at those brands grew 11% over BFCM 2025, even though average discounts fell 10%.[10]
- By day, revenue grew 10% on Black Friday 2025, about 14% on the Sunday and 11% on Cyber Monday.[10]
- About 1 in every 20 US online BFCM 2025 dollars stemmed from a message or experience sent through that one platform.[10]
Abandoned carts pile up fastest on the busiest days. If you’d like to size what recovery emails could win back over the weekend, try the cart abandonment recovery calculator.
Social commerce and affiliates
- Social media carried 4.6% of US online holiday revenue in 2025, up 40.3% from 3.3%, making it the fastest-growing channel.[1]
- Affiliates and partners, including influencers, drove 20.4% of US online holiday revenue in 2025, up from 17.6%.[1]
- For the 2026 holidays, social media’s revenue share is forecast to grow 17%, affiliates’ 12% and paid search’s 4% (published September 28, 2026).[1]
- Social commerce is predicted to grow 9 times faster than traditional ecommerce over the 2026 holidays, in a prediction published July 20, 2026.[4]
- TikTok Shop topped $500 million in US sales over the four-day BFCM 2025 weekend.[19]
- Live selling paid off. TikTok Shop sellers who hosted livestreams grew sales 84% during the 2025 BFCM campaign.[19]
Merchant and platform results
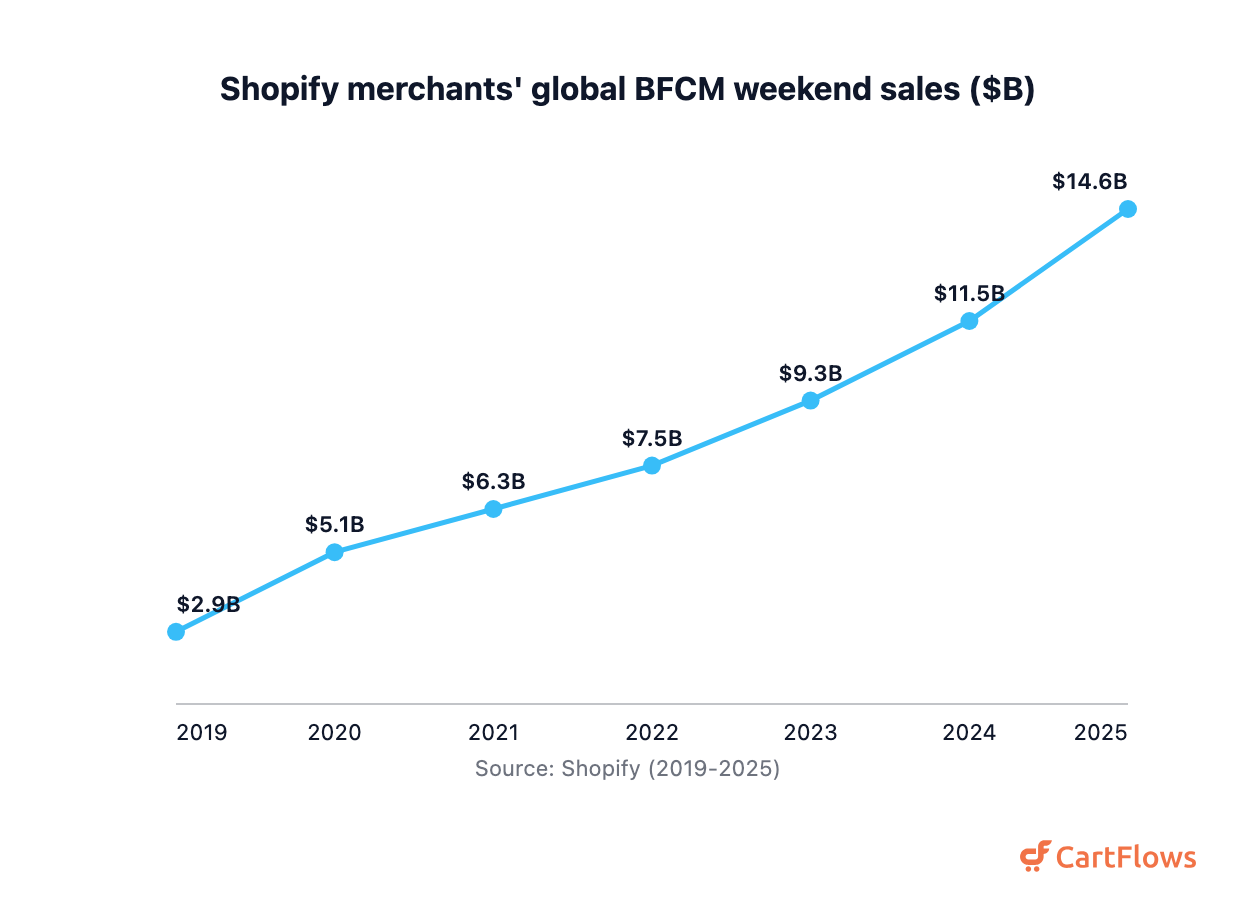
Shopify merchants sold $14.6 billion worldwide over the 2025 Black Friday Cyber Monday weekend, 27% more than in 2024.[3] That’s four days, all channels, global. On Black Friday alone they sold $6.2 billion, up 25%, and that’s part of the weekend total, not extra.[3]
Shopify BFCM 2025
- Merchant sales peaked at $5.1 million a minute at 12:01 pm EST on Black Friday 2025, up from $4.6 million.[3]
- More than 81 million consumers worldwide bought from Shopify-powered brands over BFCM 2025.[3]
- Over BFCM 2025, 94,900+ merchants had their highest-selling day ever on Shopify.[3]
- The average cart price over the BFCM 2025 weekend was $114.70, or $112.29 in constant currency.[3]
- Cross-border orders made up 16% of all Shopify BFCM 2025 orders worldwide.[3]
- Shop Pay handled 32% of Shopify BFCM 2025 orders, and sales through it rose 39%.[3]
Weekend sales have roughly quintupled since 2019, and it’s been a steady climb. Shopify merchants sold $2.9 billion that year and $5.1 billion in 2020.[3] It was $6.3 billion in 2021[3] and $7.5 billion in 2022.[3]
Growth didn’t let up after that. The weekend brought in $9.3 billion in 2023[3] and $11.5 billion in 2024,[3] before 2025’s $14.6 billion.
The biggest chains
None of the big four chains published a Black Friday 2025 sales figure, so buyer panels give the clearest read. Amazon reached 87% of US Cyber Weekend 2025 buyers, up 1 point and well ahead of Walmart and Target, in a survey of 9,199 verified shoppers who bought between November 27 and December 1.[18]
- Walmart drew 65% of US Cyber Weekend 2025 buyers, unchanged on 2024.[18]
- Target lost ground. Its share of Cyber Weekend 2025 buyers fell 4 points to 42%.[18]
- 13% of Cyber Weekend 2025 buyers shopped at Best Buy, the smallest share of the four chains measured.[18]
- Early events pulled demand forward: 59% of Cyber Weekend 2025 shoppers had also bought during an earlier sale such as Prime Big Deal Days, Target Circle Week or Walmart Holiday Deals.[18]
- Walmart delivered 57% more orders from its stores on Black Friday 2025 than a year earlier, and 44% more orders arrived in under three hours.[20]
- Nearly 10 million shoppers used the Walmart app inside its stores over Black Friday and Cyber Monday 2025.[20]
- Sellers on Walmart’s fulfillment service shipped 80% more two-day items and 250% more next-day items from just before Thanksgiving through Cyber Monday 2025.[20]
- Amazon’s latest published recap covers 2024. More than 60% of Amazon store sales in its November 21 to December 2, 2024 event came from independent sellers.[21]
Other platforms and traffic
- Order volume on Salesforce’s own point-of-sale system rose 96% on Black Friday 2025 among its retail customers, not the whole market.[4]
- VTEX customers, mostly Latin American enterprise retailers, processed $1.0 billion of GMV over BFCM week 2025, up 18.2% in US dollars.[22]
- Stores doubled as warehouses. 2 in 5 VTEX BFCM 2025 orders were fulfilled from physical-store inventory.[22]
- Virtual waiting rooms handled 77.5 million Black Friday 2025 visitors, up 16%, across 138 retailers.[23]
- Bots and data centers generated 28% of web requests over Cyber Five 2025, down from 36% in 2024.[23]
WooCommerce merchants
- In a July 2025 survey of 249 merchants, 73% said the holiday period brings in over 20% of annual revenue.[24]
- 46.1% of seasonal WooCommerce merchants planned a BFCM 2025 sale, and 33.3% were still undecided.[24]
- Bundles and buy-more-save-more offers led the 2025 promotion plans, chosen by 27.4% of those merchants, with tiered discounts at 18.2%.[24]
- Speed moved up the list. 33.4% of surveyed merchants focused on site performance for the 2025 holidays, up from 13%.[24]
What does that mean for a WooCommerce store? The merchants surveyed leaned on bundles over deeper markdowns. Email data points the same way, with spending up even as promo discounts shrank. A WooCommerce order bump at checkout or one-click upsells after payment lift order value without cutting price again. That’s where these numbers point.
Small Business Saturday and Giving Tuesday
Shoppers reported spending about $18 billion at small businesses on Small Business Saturday, November 29, 2025, in a survey of 2,945 consumers.[25] That’s down from about $22 billion estimated for 2024.[26] They’re self-reported estimates, not receipts, so read the drop with care.
- Consumer-reported Small Business Saturday spending totals $241 billion since tracking began in 2012.[25]
- Local money stays local. 68 cents of every dollar spent at a US small business stayed in the community, in a 2025 economic impact study.[25]
- Intent ran high: 86% of consumers said they were likely to shop small during the 2025 holiday season.[25]
- Small-business owners expected about 20% of their annual revenue to come from Small Business Saturday 2025 sales.[26]
- Among planned Saturday shoppers in 2025, 80% cited supporting local businesses as a reason to shop that day.[2]
- GivingTuesday on December 2, 2025 raised $4.0 billion in total US giving, up 13%.[27]
- Participation grew too. 38.1 million Americans took part in GivingTuesday 2025, up 6%, and 19.1 million of them gave money.[27]
- US GivingTuesday donations have reached $22.5 billion in total since 2012.[27]
Black Friday statistics that don’t hold up
Two trackers measured US online sales on Black Friday 2025 and got $11.8 billion[1] and $18 billion.[4] Neither is wrong. They measure different things, and that’s the most common reason Black Friday numbers look contradictory. Here are the ones worth double-checking.
- Adobe’s $11.8 billion and Salesforce’s $18 billion aren’t comparable. Adobe counts observed spend on US retail sites. Salesforce extrapolates its commerce panel to the whole industry. The gap isn’t even consistent: Salesforce’s US Cyber Monday figure of $13.6 billion sits below Adobe’s $14.25 billion.[4]
- “Cyber Week” means two different windows. Adobe’s covers five days, Thanksgiving through Cyber Monday, for $44.2 billion. Salesforce’s 2025 figure of $79.6 billion covers seven days, November 25 to December 1.[4]
- Adobe’s 2026 discount forecast compares against the wrong year. Its release labels 2024 actuals, such as 30.1% for electronics and 28% for toys, as “2025.” Against the real 2025 peaks of 30.9% and 29.6%, the 2026 forecast is lower in every category.[1]
- NRF’s 2025 shopper forecast was measured against a forecast. It called 186.9 million shoppers “up more than 3 million” from 183.4 million, but 183.4 million was the 2024 forecast. The 2024 actual was 197 million, and the 2025 actual of 202.9 million beat the forecast by about 16 million.[2]
- The widely repeated 5.86% Black Friday conversion rate has no primary source. It’s credited to Shopify, but no Shopify page publishes it. The only verified Black Friday conversion figure is the 38% lift for AI-referred visits.[1] For sourced baselines, see our ecommerce conversion rate benchmarks.
- Foot traffic went up or down, depending on the panel. Door counters from Sensormatic showed a 1.7% drop on Black Friday 2025.[12] Phone-location data from pass_by showed a 1.17% rise.[14] Don’t average them.
- Amazon’s “record Black Friday 2025” lines are 2024 text. Amazon published no Black Friday recap for 2025, so the “biggest ever” claims circulating as 2025 results come from its 2024 release.[21]
- Adobe revised its own toy discount. Its December 2, 2025 release put the toys peak at 28%.[1] The January 2026 final says 29.6%, and electronics moved from 31% to 30.9%.[1] If you cite either number, use the January final.
- Adobe gives two Thanksgiving 2026 AI-traffic forecasts. Its press release says AI traffic will rise 159% year over year on Thanksgiving, while its report page says 141%, both dated September 28, 2026.[1] The season figure of 130% matches on both.
- The widely quoted 87.3 million Black Friday online shoppers is a 2024 figure. The 2025 count was 85.7 million.[2]
Each of these survived because the headline travels and the definition doesn’t. So check the scope, the window and the year before you quote a Black Friday number.
Sources and methodology
Every figure here was read on the page, filing or data file of the organization that produced it. We didn’t take numbers from aggregators. The citations trace to 27 distinct primary publishers.
We dropped 46 figures as unverifiable or contradicted. One example: the widely quoted $12.5 million per minute Black Friday 2025 peak doesn’t appear in any Adobe release, recap deck or data file, so it’s out.
Adobe and Salesforce don’t measure the same thing. Adobe reports observed spend on US retail websites, while Salesforce extrapolates its commerce panel to the whole industry. Their figures appear side by side but are never averaged or treated as one series. Mastercard’s totals include in-store sales, and NRF’s shopper counts are survey estimates.
Every forecast is labeled as one, with its publication date. Where a 2024 figure is the latest a publisher has released, it’s marked as 2024.
Last updated October 1, 2026.
Final Thoughts
Black Friday is less about the deepest discount than it used to be. Shoppers are researching longer, buying on phones, arriving from AI tools and spreading purchases across the whole weekend. For a WooCommerce store, the unglamorous work matters most. Your checkout has to hold up under a traffic spike, so speed up your WooCommerce checkout before November.
So don’t treat November 27 as a single-day race to the lowest price. Plan the whole week, test your checkout on a phone, and give people a reason to add one more thing to the cart. The stores that do well aren’t the ones shouting loudest. They’re the ones that make buying easy.
Frequently Asked Questions
References
- Adobe Analytics, news.adobe.com
- National Retail Federation, nrf.com
- Shopify, shopify.com
- Salesforce, salesforce.com
- Mastercard, mastercard.com
- Deloitte, deloitte.com
- Bain & Company, bain.com
- EMARKETER, emarketer.com
- DataWeave, dataweave.com
- Klaviyo, klaviyo.com
- Visualping, visualping.io
- Sensormatic Solutions, sensormatic.com
- RetailNext, retailnext.net
- pass_by, passby.com
- Placer.ai, placer.ai
- PwC, pwc.com
- LendingTree, lendingtree.com
- Numerator, numerator.com
- TikTok Shop, tiktok.com
- Walmart, corporate.walmart.com
- Amazon, aboutamazon.com
- VTEX, via SEC filings, sec.gov
- Queue-it, queue-it.com
- WooCommerce, woocommerce.com
- American Express, americanexpress.com
- U.S. Small Business Administration, sba.gov
- GivingTuesday, givingtuesday.org